If planning and budgeting for your ad campaigns feels too much like a finger-in-the-wind scenario for your liking, you’ve come to the right place.
This is where you discover a way to know how you stack up against your competitors so you can at least give yourself a fighting chance out there.
Not only can these benchmarks help you plan your campaigns, they can also help you when pitching your plans to your team or client.
Our recent study partnered with AdClarity to help you not only analyze creative output and top publishers, but also compare total ad spending and seasonal trends (and more) to change the way you advertise for good.
Note: this article is just the first part of the study. We’ll highlight the overall trends in ad spending, and publish more detailed findings from this research in the near future in a few follow-up posts, so keep an eye out for those!
Why You Should Benchmark Digital Ad Spend
If you know exactly how much your competitors are spending per month or per year on social advertising, you can allocate the right level of budget to your own Facebook ads, for instance.
If you know which publishers are the most popular in your competitive landscape, you can tactically place your own display ads to know you’ll be reaching an interested audience.
Let’s dive into our findings and explore what seasonal spending looks like for retail advertising, which industries pay more for desktop ads than they do for mobile and, of course, what AdClarity can tell you about your own competitors.
Our Methodology
The dataset for this study was provided by our partners AdClarity to demonstrate overall trends in advertising spend and campaign activity in the US from January 2021 to May 2023. It covers the digital advertising activity of a total of 956 domains from the top players in 13 industries, namely:
- Dating
- Fashion & Apparel
- Finance
- Food Delivery
- Home & Décor
- Jobs
- Media
- Online Education
- Pets
- Retail
- SaaS
- Streaming Services
- Travel
The purpose of this report is to present trends in action from some of the world’s biggest advertisers to inspire benchmarking for your own ad spending strategies—it doesn’t contain exact numbers and shouldn’t be used to reference as such.
In the process of this research, we partnered with agency founder Tim Cameron-Kitchen and our in-house Performance Marketing Team Lead Laura Cruceru to provide their commentary on the data.
Overall US Digital Advertising Spending Trends
Taking the zoomed-out view of monthly ad spend and CPM (cost per 1,000 impressions) across all domains, we can see that the levels remained more or less stable for two years.
There is, however, some seasonality on display in the peaks during summers and winters and troughs during falls and springs in overall spend:
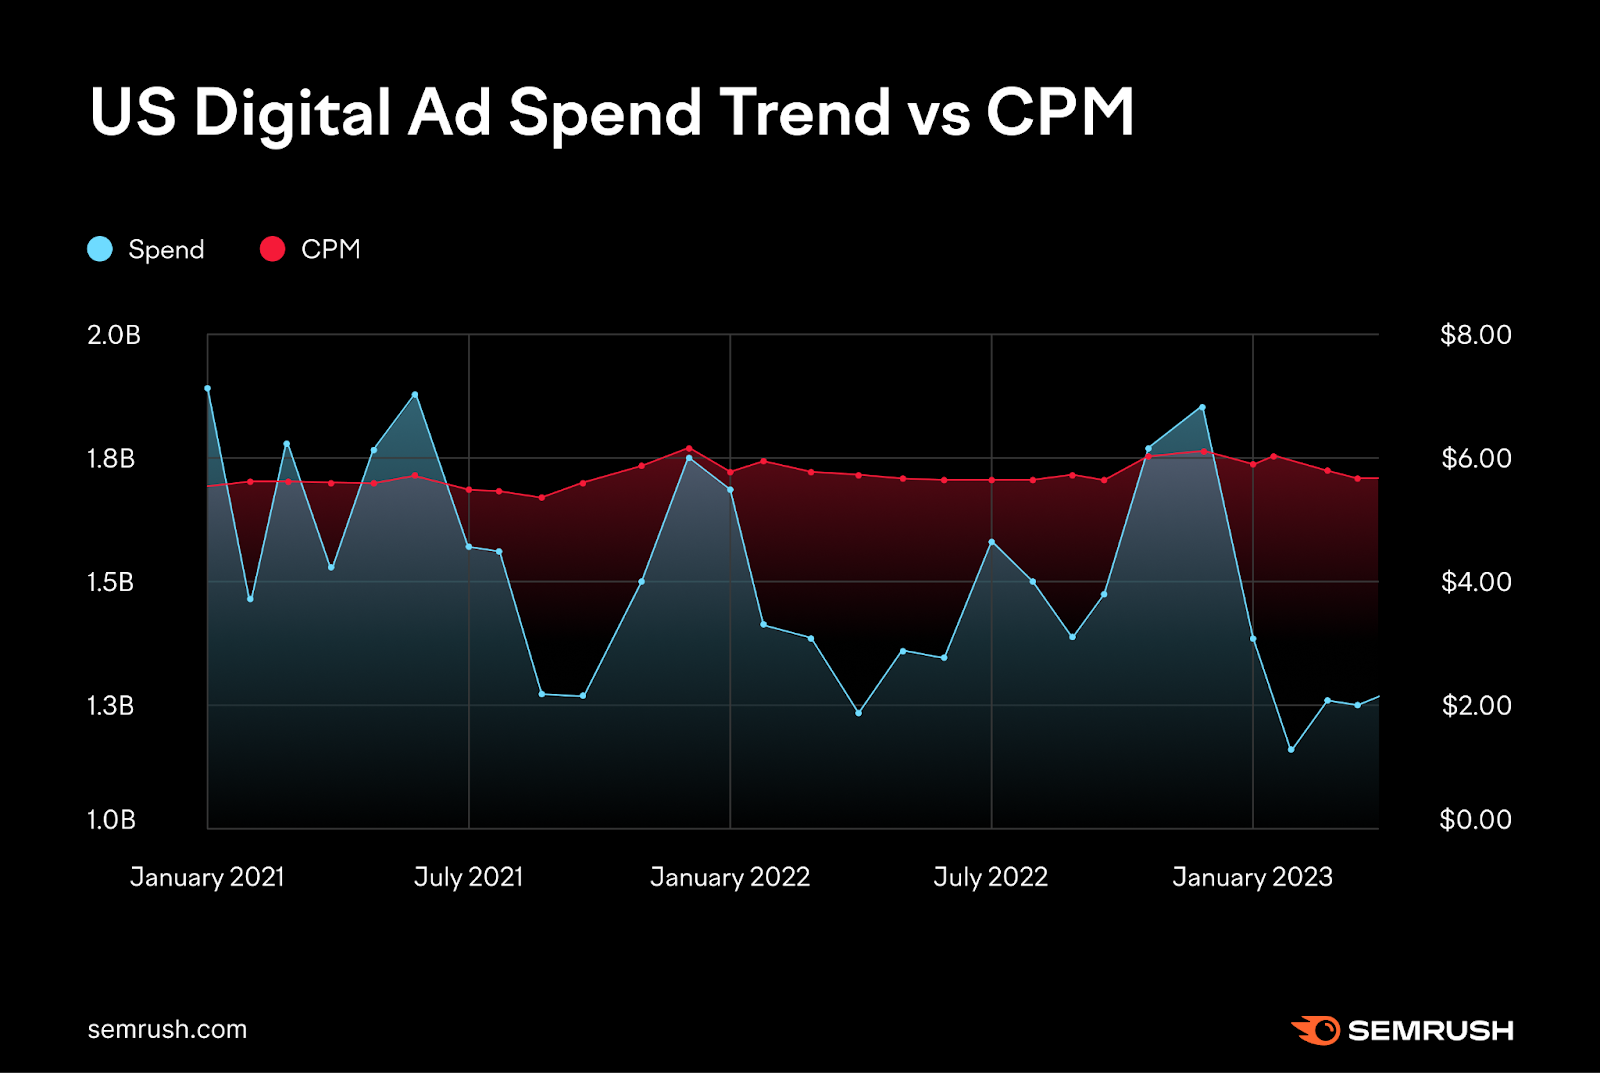
The peaks displayed toward the end of both 2021 and 2022 are clearly related to the festive period and the likes of Black Friday, when most retailers typically ramp up their ad spend to engage bargain hunters.
Comparatively, the declines in the autumn months might suggest alignment to vacation habits—many people go away in August, so it might not be a fruitful time to advertise.
One caveat to bear in mind here is the presence of Amazon.com amongst these domains—its spend far outstrips that of most other domains, so it naturally has a dramatic effect on any noteworthy trends.
Total Ad Spend by Industry
When we break the AdClarity data down by industry, we see the obvious impact that Retail in particular has on the overall ad spending average.
It’s no surprise that, at $443.4M per month, it spends far more than any other industry when you consider the presence of giant ecommerce players like Amazon, Target and Walmart.
But, the fact that it spends 95% more than the second-biggest spender, Streaming Services ($227.3M per month), is remarkable:
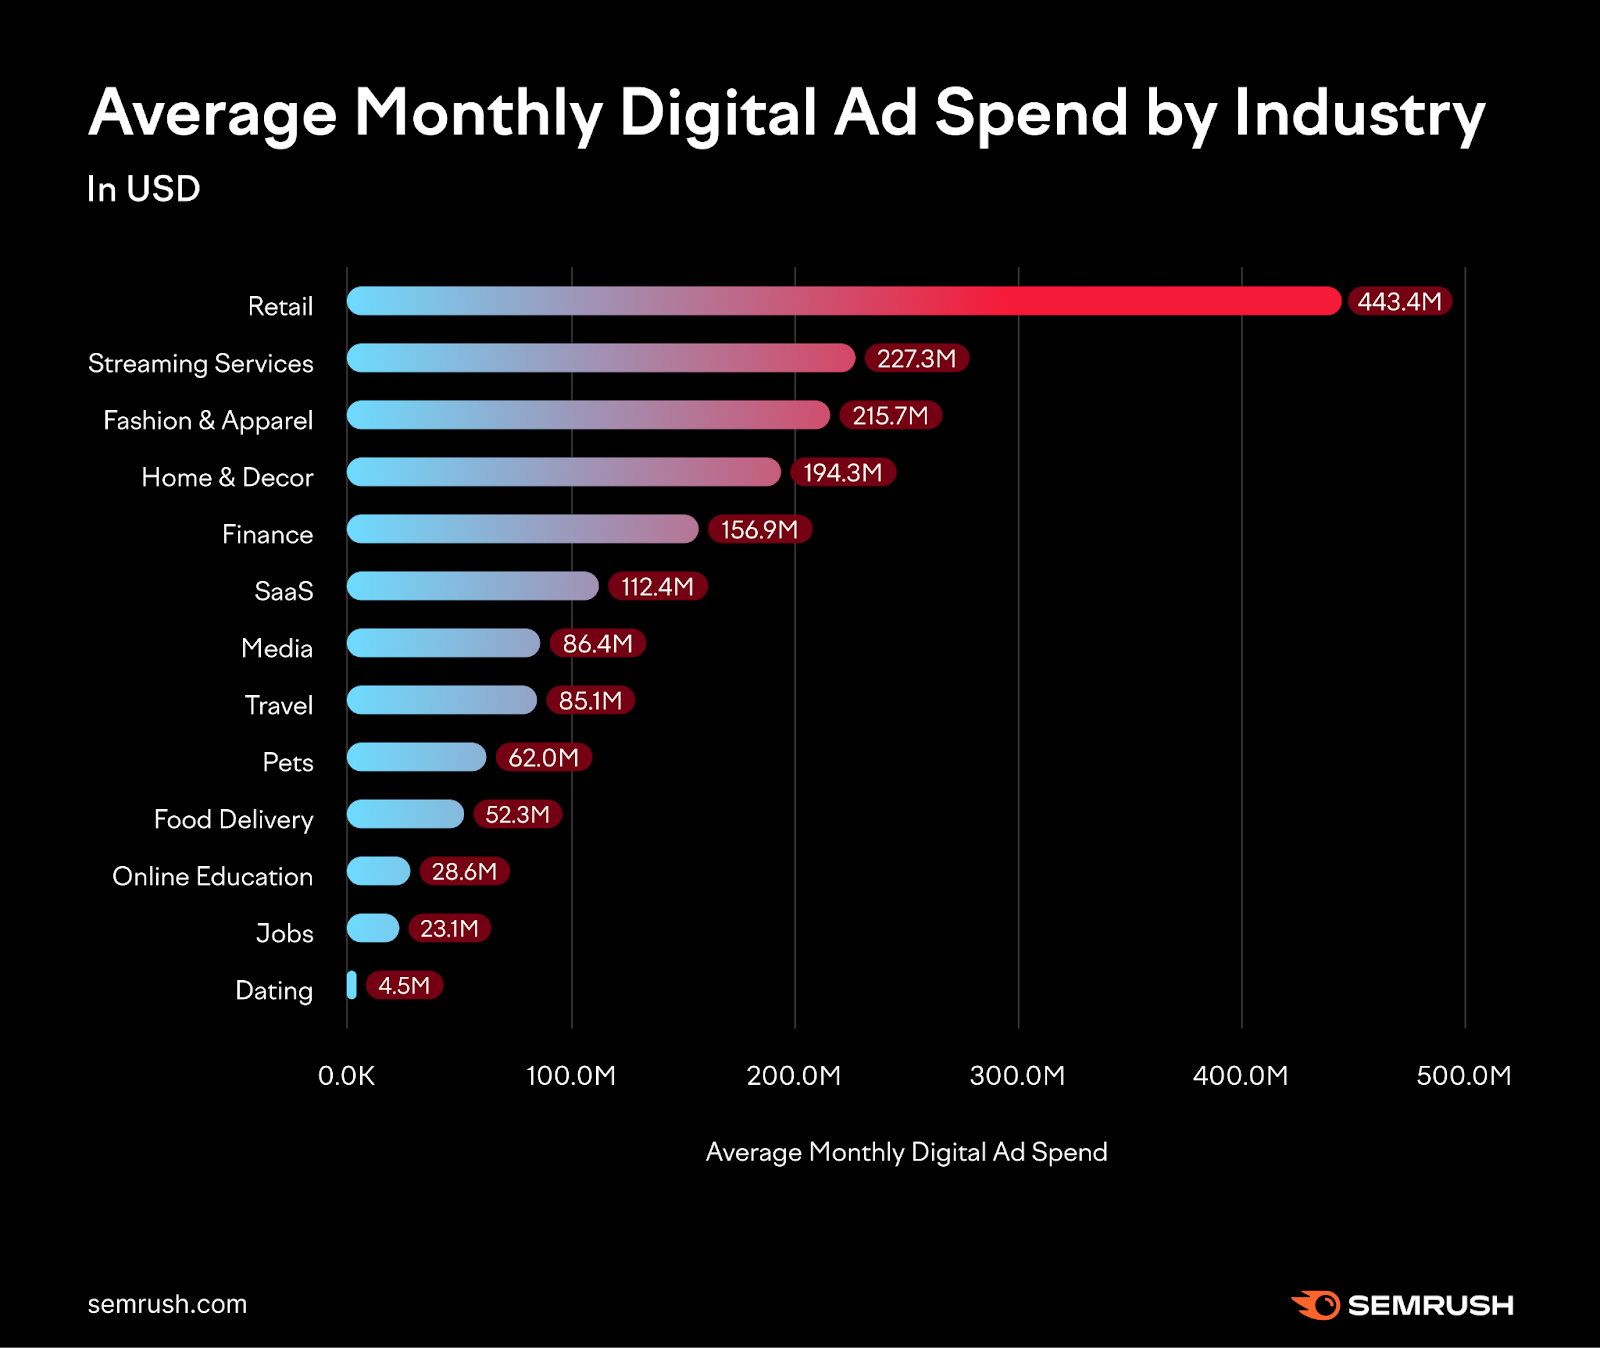
It rarely tells the whole story when comparing like-for-like spending between industries, but it is intriguing that domains in Food Delivery, Online Education, Jobs and Dating spent less than all other industries here.
Keep in mind that the time period of this study (January 2021 to May 2023) included the immediate emergence from a pandemic, which could have influenced spending in certain impacted industries.
With my 15 years of experience, I’ve witnessed the game-changing impact of competitor ad spending data, especially with tools like AdClarity. In the Retail sector, where industry leaders like Amazon allocate a staggering $443.4 million monthly, Semrush and AdClarity together equip you with the insights to strategically plan and stay ahead of the curve in your advertising efforts.
Related reading: Competitor Ad Spend: How to Uncover Your Rival's Budget
Ad Spend by Industry Trend
To learn more, we need to look at the trends in ad spending during the ‘low’ and ‘high’ seasons within this time period:
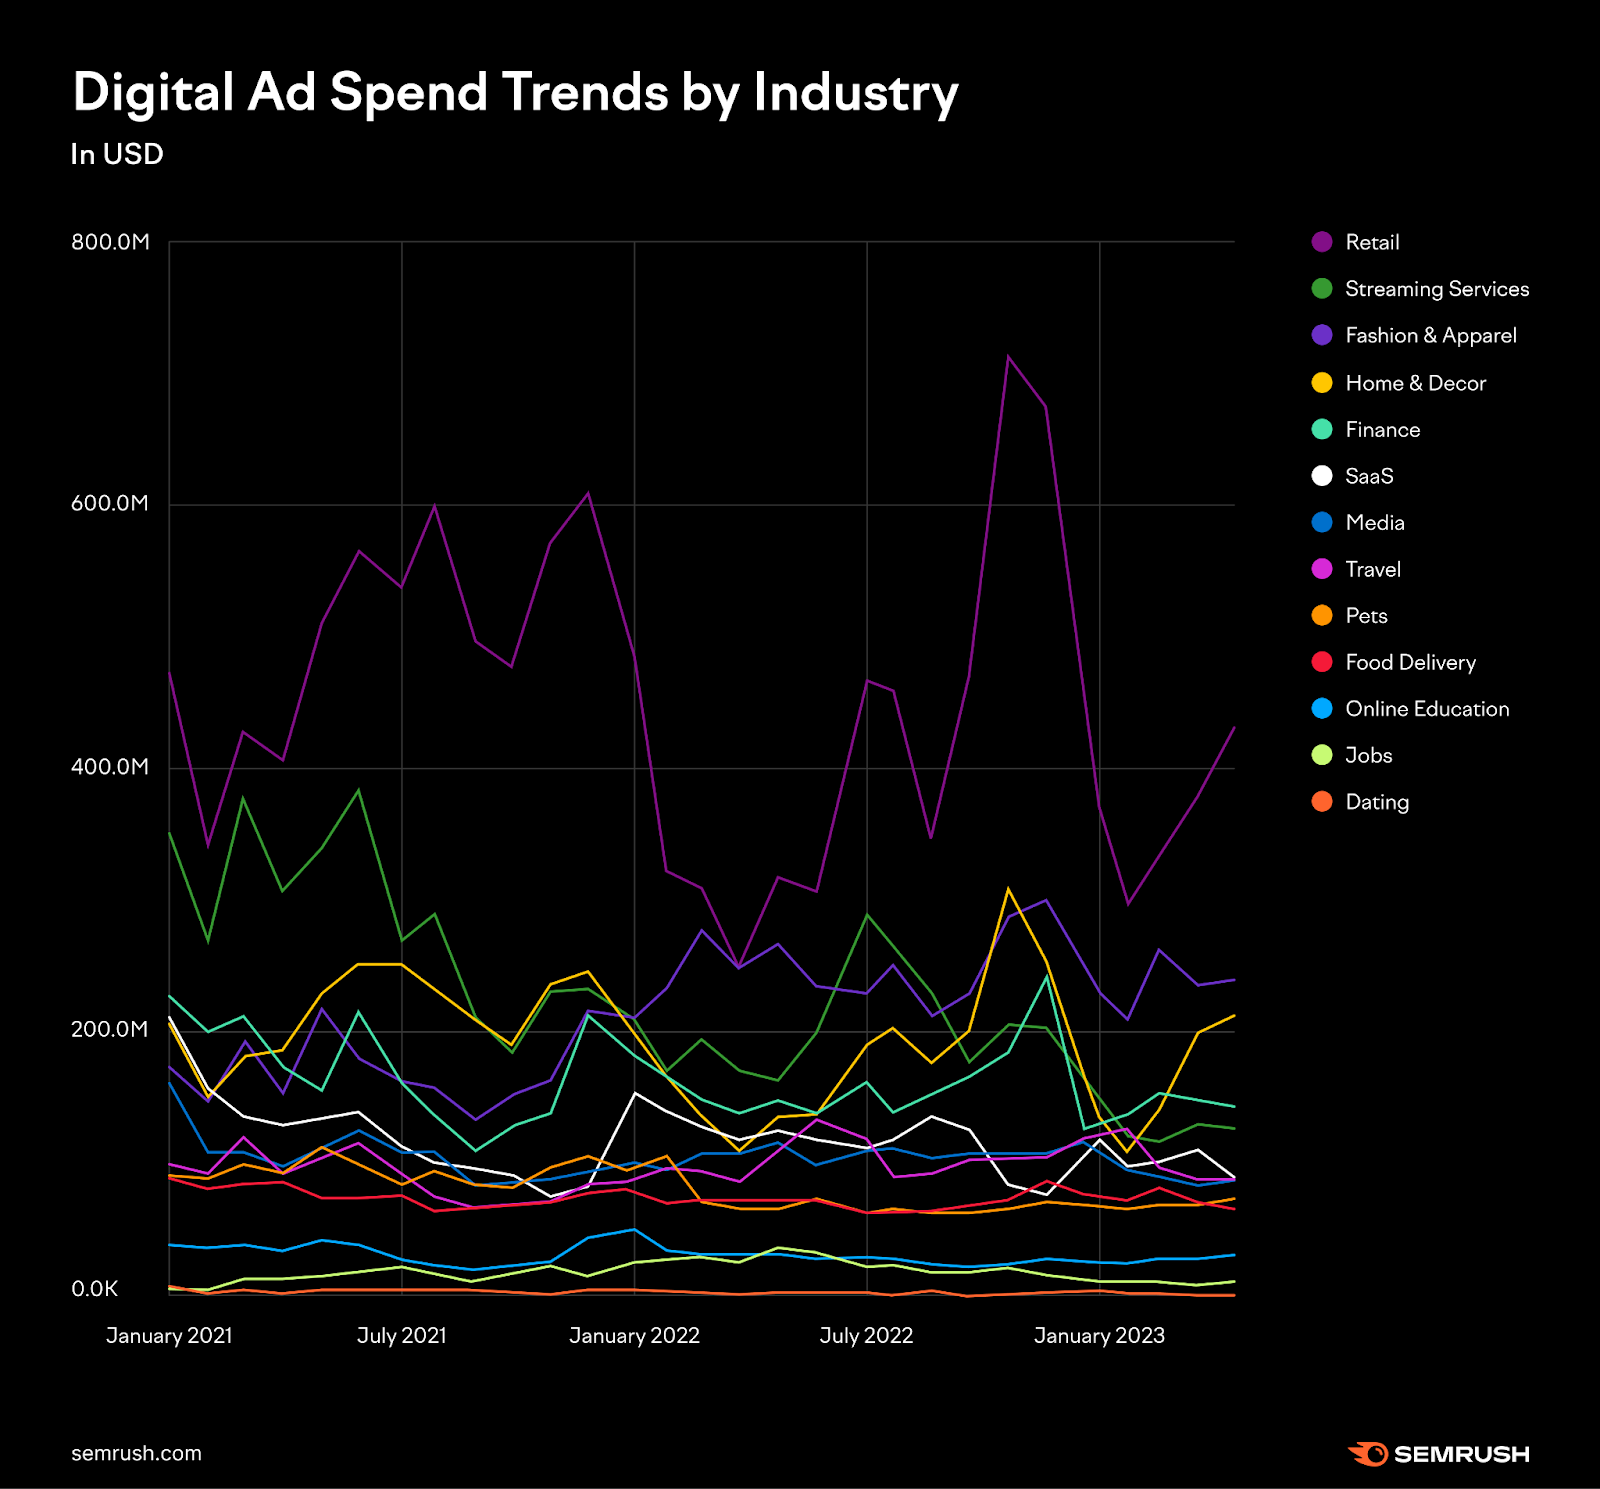
As mentioned, the most significant spending throughout is from the Retail industry, but it’s also the one that’s most impacted by seasonality.
At its lowest, the industry spent $243.4M in April 2022, which is still higher than most other industries spent at any point during this time period. At its highest, it spent almost three times as much, reaching $718.4M in November 2022—a clear indicator of Black Friday focus.
Other industries also demonstrate here how seasonality affects their spending—Travel domains peak in June and Finance and Home & Décor domains tend to peak in December. They also show year-on-year increases in spend during those periods, which suggests they are well aware by now of what works and when (and, indeed, how much money to put behind each campaign).
You can explore similar advertising spending trends among your competitors by researching their domains in the AdClarity app.
Advertising Spending by Platform
Benchmarking by platform can also come in very handy when you’re planning where to put your budget. We analyzed advertising spend by industry across these three platforms to understand how our top players chose to spend their ad budgets:
- Desktop (display & video ads)
- Mobile (display & video ads)
- In-app (display & video ads on iOs & Android)
This chart depicts platform distribution of ad spend across our selected industries—to capture the most up-to-date trends, we only used data from 2023 here:
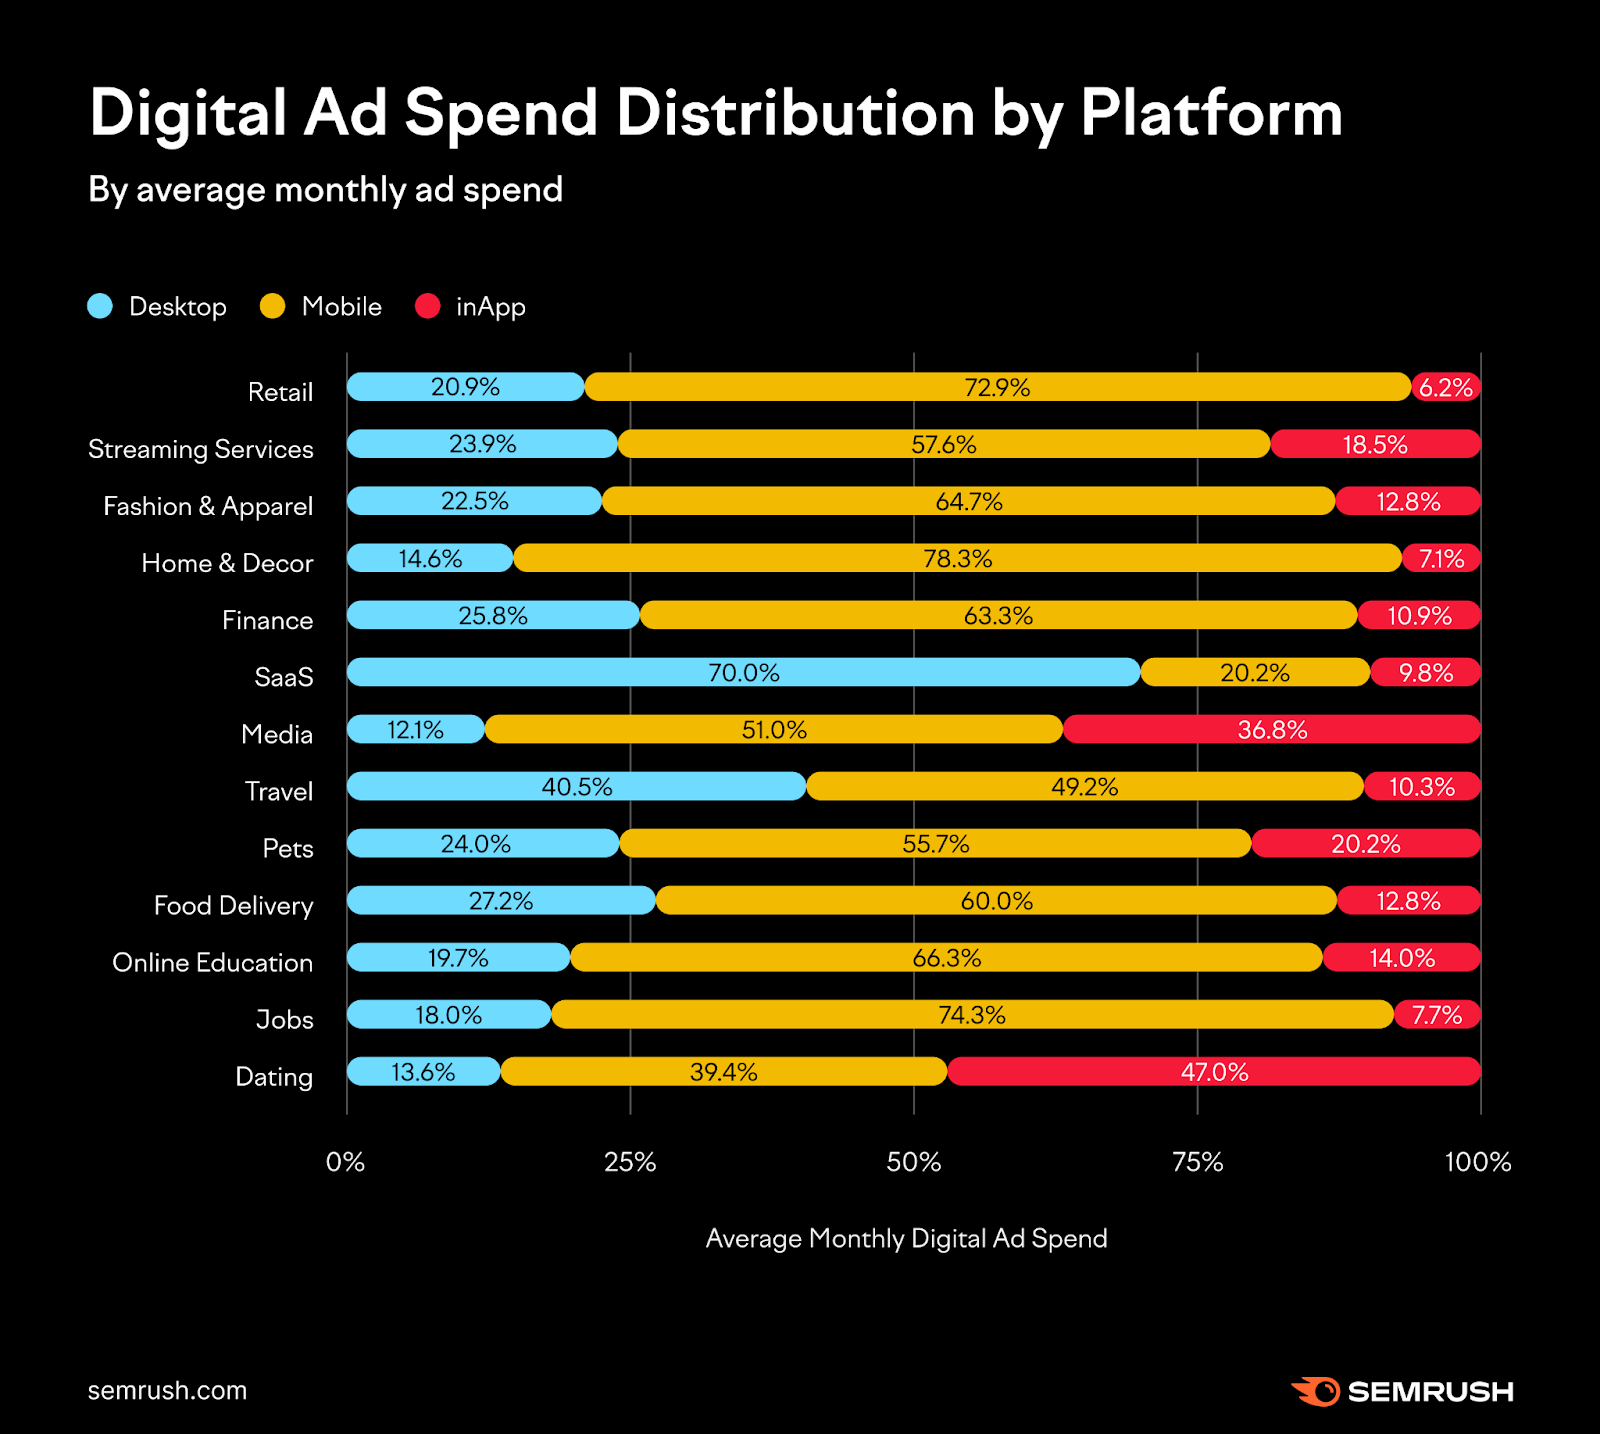
One thing that’s immediately clear from this chart is the popularity of mobile as a platform in almost every industry. The exception is the SaaS industry, which pushed only 20.2% of its ad spend into mobile, with 70% going to desktop ads and 9.8% to in-app ads.
Perhaps unsurprising given that 90% of all SaaS investment goes to B2B companies. Those will be the most likely to spend on advertising, and their customers will be mainly desktop based.
Other industries that see the value in desktop ads for their particular offerings are Travel, Finance and Food Delivery.
This might indicate ad relevance geared toward people at work, who could be planning everything from what to eat for dinner to where to go on holiday next summer.
Mobile ads appear to be most popular in the Retail, Jobs and Home & Décor industries, appealing to people’s needs to look for something new.
Meanwhile, in-app ads lean into the realm of hyper-personalization for domains in the Media, Pets, Streaming and Dating industries.
Advertising Spending by Channel
Understanding the most popular channels in your niche can also help when it comes to the likes of media planning. We investigated this across three groups:
- Social (video and display ads on Meta, Instagram, Twitter, and TikTok)
- Video (desktop, mobile, and in-app video ads on YouTube and other video sites)
- Display (desktop, mobile and in-app display ads)
Knowing industry-specific ad spending trends is paramount, and AdClarity is instrumental in providing these insights. In the Travel industry, we observe a substantial allocation towards social and video ads. This knowledge empowers marketers to make informed decisions, giving them a competitive edge in their niche.
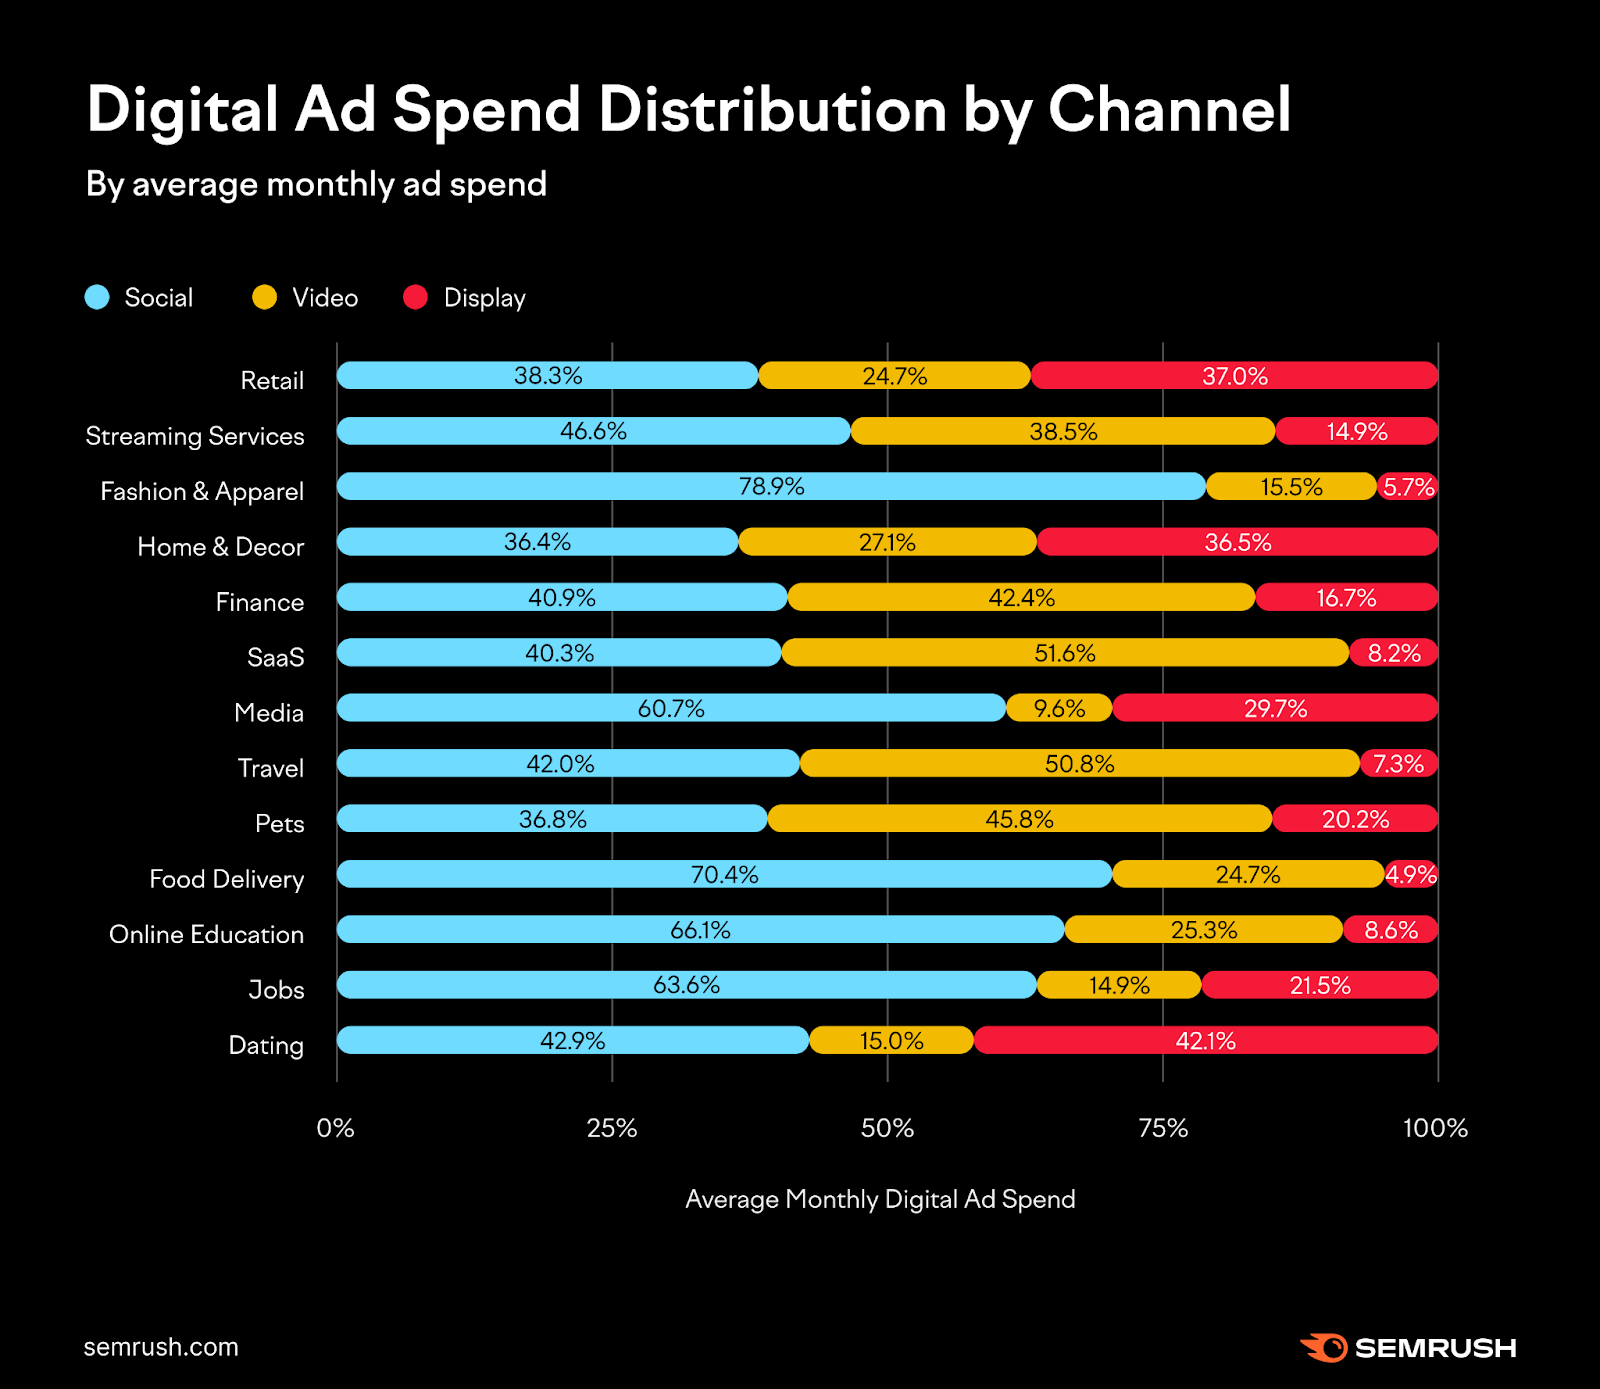
It’s perhaps no surprise that social advertising was the runaway winner in the Fashion & Apparel industry in terms of average monthly spend (78.9%). Food Delivery (70.4%) and Online Education (66.1%) also scored highly on social, but comparatively, Home & Décor, Pets and Retail relied on this channel the least.
Businesses in the SaaS, Travel and Pets industries concentrated more on video ads (51.6%, 50.8% and 45.8% respectively), while Media (9.6%) and Dating (15%) hardly depended on video ads at all.
Display ads proved to be most useful to Dating, Retail and Home & Décor companies, but not so much to those in Fashion and Food Delivery.
If we look at the trend over time in the next graph, we see that there were significant changes in the distribution of video versus display ads. However, if we compare ad spend via those channels in May 2021 to May 2023, it turned out to be at around the same level:
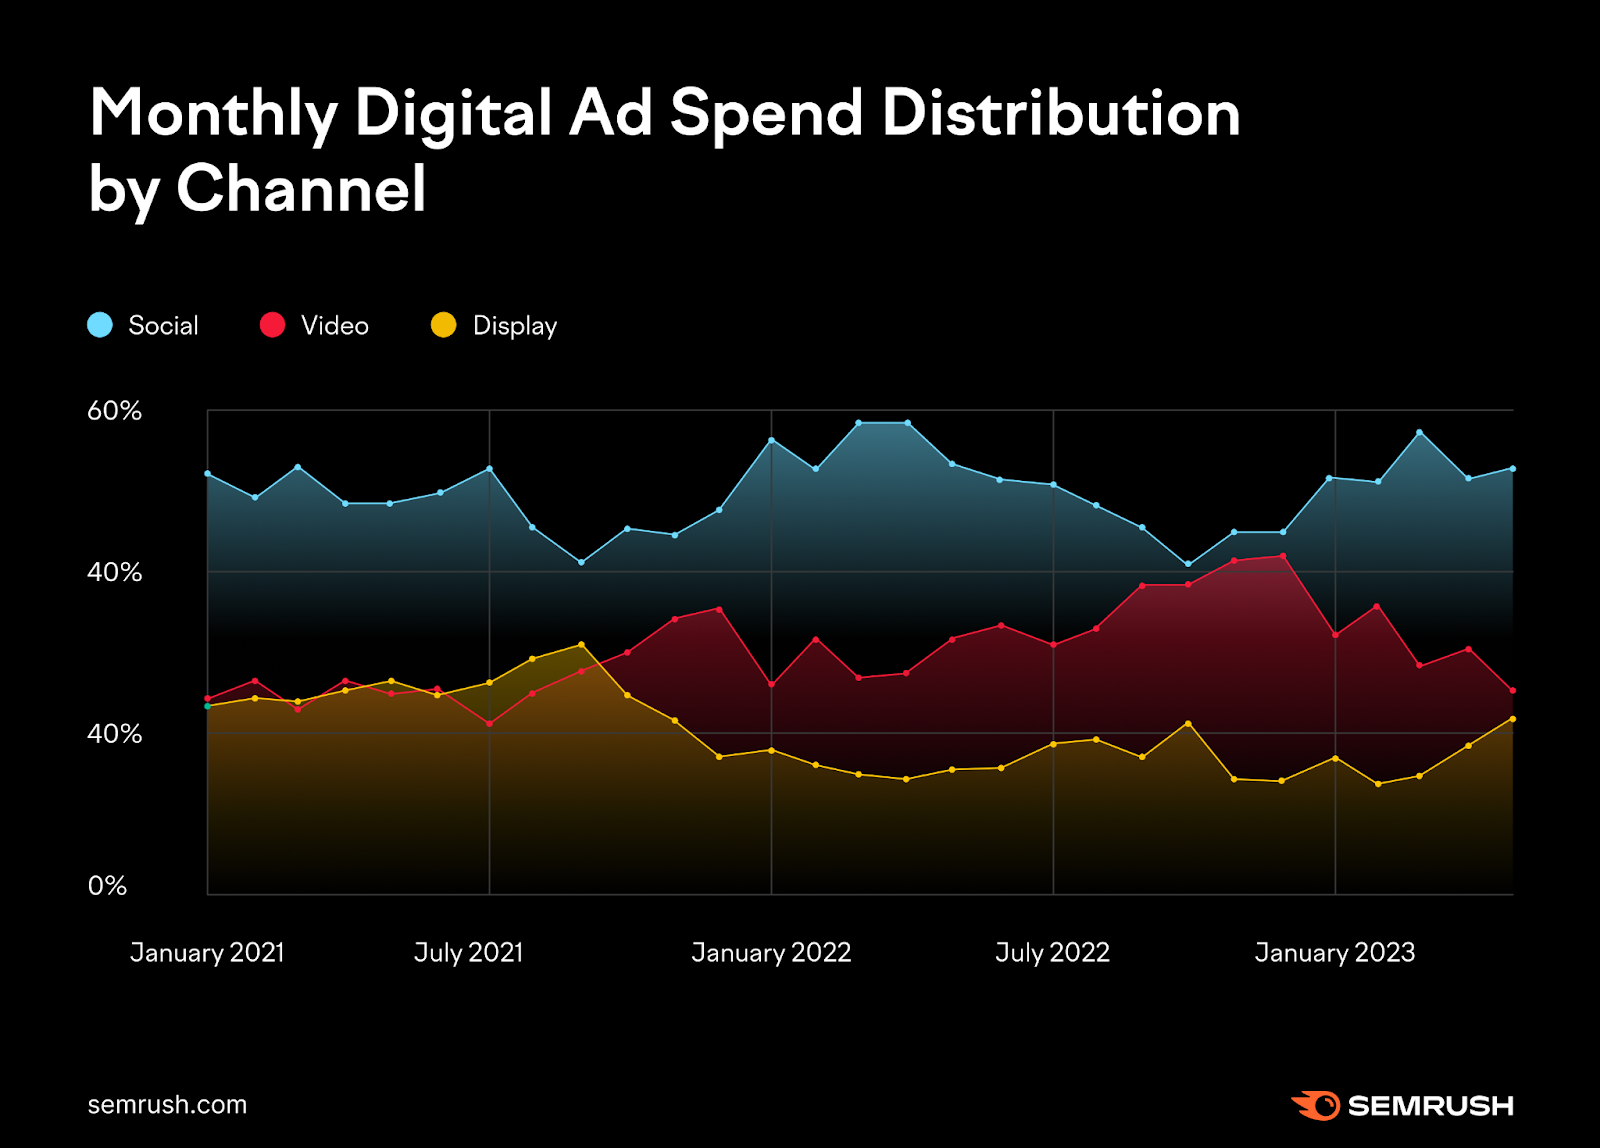
Some advertisers have been viewing Display advertising as a lost cause following blocking of third party cookies by Apple, but it's interesting to see that it seems to be gaining ground on video advertising spend in 2023!
Benchmark How Much to Spend on Advertising with AdClarity
From this data, you can get an early indication of the competitive ad spend within your industry and use it to form your own benchmarks as you plan ahead.
While budgeting and media planning for your next campaign, keep these ad spend benchmarks in mind.
With a deeper dive into the capabilities of AdClarity in the Semrush App Center, you can find more digital advertising intelligence about your specific competitors, including their spend per campaign, their seasonal behaviors and even their creative preferences.
As you formulate your advertising strategy, check out our other parts of the study on ad types and CPM to help you carve out a competitive advantage in your niche.
![Advertising Trends: Using Competitor Ad Spending Data for Benchmarking [Study]](https://semi.toolspur.com/cdn/blog/uploads/media/c3/c6/c3c6fa0a3e8b876241fa6adbba48a818/474886bf84ce4e11bbbde6ee96f3d14e/adclarity-data-study.svg)