What Is Engagement Rate in GA4?
The Google Analytics 4 (GA4) engagement rate metric is the number of engaged sessions relative to the total number of sessions on your website—expressed as a percentage.
Here’s what the formula looks like:
Engagement rate = (number of engaged sessions / total number of sessions) x 100
A session is a visit. And an engaged session is a visit when the user interacts with your site in a meaningful way by meeting at least one of these criteria:
- The session includes a key event (the name for GA4 conversions)
- The session includes two or more pageviews
- The session lasts for at least 10 seconds
Let’s say your website has 1,000 sessions over a period of time and 546 of those sessions meet one or more of those three criteria. Your engagement rate is 54.6% ((546 engaged sessions / 1,000 sessions) x 100).
Engagement Rate vs. Bounce Rate
Engagement rate is the primary way that Google Analytics 4 measures user engagement.
Bounce rate is another user engagement metric, but it takes the opposite approach. And measures the percentage of sessions that are not engaged.
Bounce rate = (number of sessions that are not engaged / total number of sessions) x 100
A session must either be engaged or not engaged.
So, in the example above, we know that 454 sessions didn’t meet any of the three criteria to qualify as an engaged session (1,000 sessions - 546 engaged sessions = 456 unengaged sessions). Meaning your bounce rate is 45.4% ((454 unengaged sessions / 1,000 sessions) x 100).
Why Is Engagement Rate Important?
Engagement rate matters for two main reasons:
Site-Wide Performance Insights
Monitoring your overall engagement rate helps you spot whether there are problems users are having on your website, so you can quickly address them.
To understand how, take a look at this GA4 graph showing a website’s daily engagement rate from January 2024 through August 2024.
The engagement rate mostly ranges from about 45% to 75%. But the number dipped below 20% in late March. Which likely indicates a user experience problem that was quickly addressed.

When engagement declines like this across your entire website, you should check for technical issues related to page speed, link implementation, etc. (We’ll go over how to find these later in this guide.)
Some other common user experience issues that could cause declining engagement include:
- Too many display ads: If you run ads on your site, a declining change in the engagement rate can help you spot when you’re showing too many advertisements
- Site redesign problems: You may have recently redesigned your site with the best intentions. But if you didn’t do adequate testing before launch, a declining engagement rate may tell you the new design is confusing your visitors.
Page-Specific Performance Insights
You can also analyze engagement rates for individual pages and compare these data points against your site’s total engagement rate to spot poor-performers that need to be improved.
Here are the top 10 pages from a website with an average engagement rate of 47.59%. You can see that each individual page has its own engagement rate.
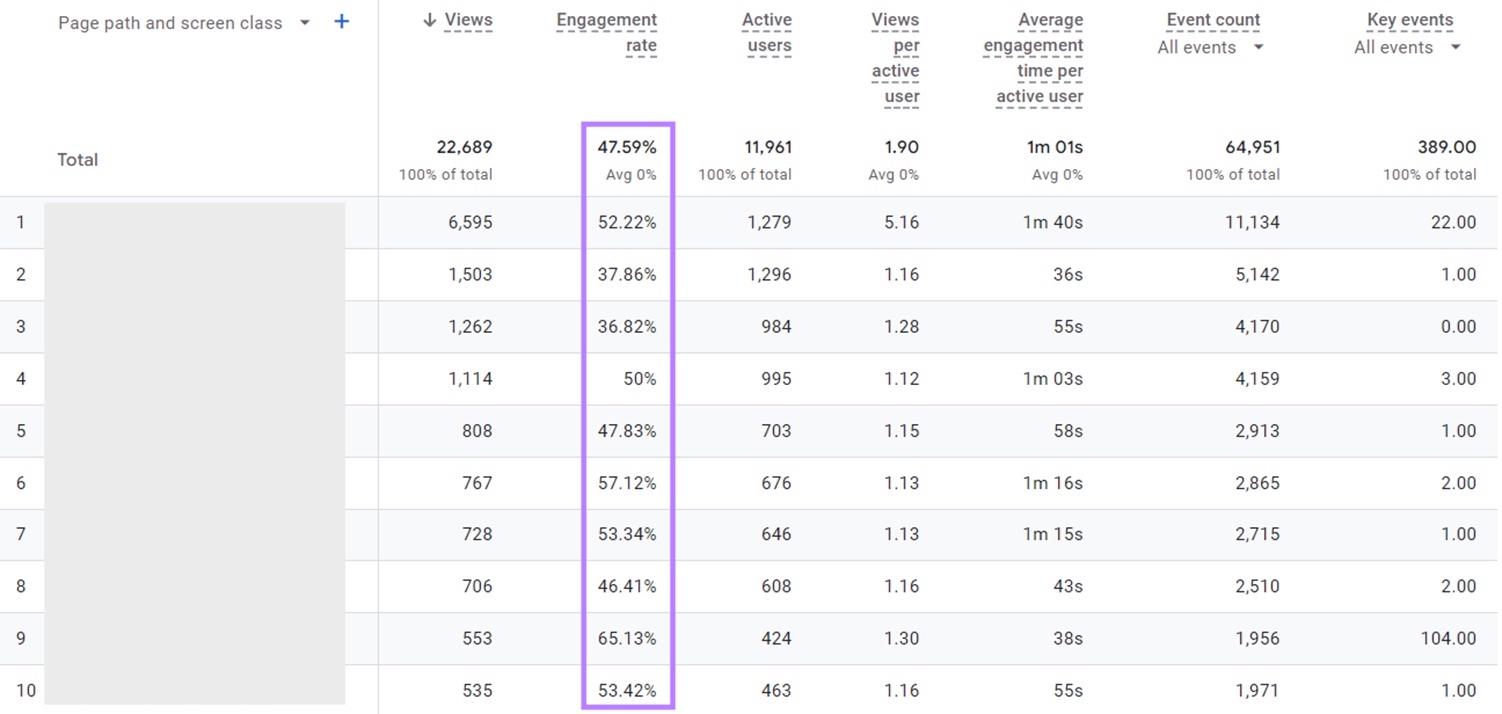
Later, you’ll learn how to create this same report and how you can improve the engagement rates of your low-performers. And that can lead to better retention and more conversions.
What Is a Good Engagement Rate in GA4?
The standard of a good engagement varies by industry and changes based on content type as well.
For example, you’d expect a higher engagement rate on a contact page than a highly technical blog post.
Across all industries and content types, the median site-wide engagement rate is 56.23%, according to a comprehensive benchmarking study from Databox.
That study included engagement rate data by industry. The lowest engagement rates were in consulting and professional services as well as SaaS industries. And the highest engagement rates were in health/wellness and ecommerce/marketplaces.
Here are average engagement rates by industry, ranging from lowest to highest
- Consulting and professional services 52.43%
- SaaS: 52.43%
- IT and software: 52.64%
- Food: 53.74%
- Real estate: 54.13%
- Technology: 54.71%
- Construction: 54.92%
- Education: 57.19%
- Manufacturing: 58.33%
- Healthcare: 59.97%
- Apparel and footwear 60.23%
- Automotive: 60.36%
- Travel and leisure 61.55%
- Health and wellness: 62.22%
- Ecommerce and marketplaces 63.86%
How Can You See Engagement Rate in GA4?
In GA4, you can view the average engagement rate for your entire site as well as specific engagement rates for each page.
You’ll find your site-wide engagement rate in your Traffic acquisition report. And you can customize that report to focus your analysis on engagement rate.
Here’s how:
In the left-hand navigation, click “Reports” > “Acquisition” > “Traffic acquisition.”
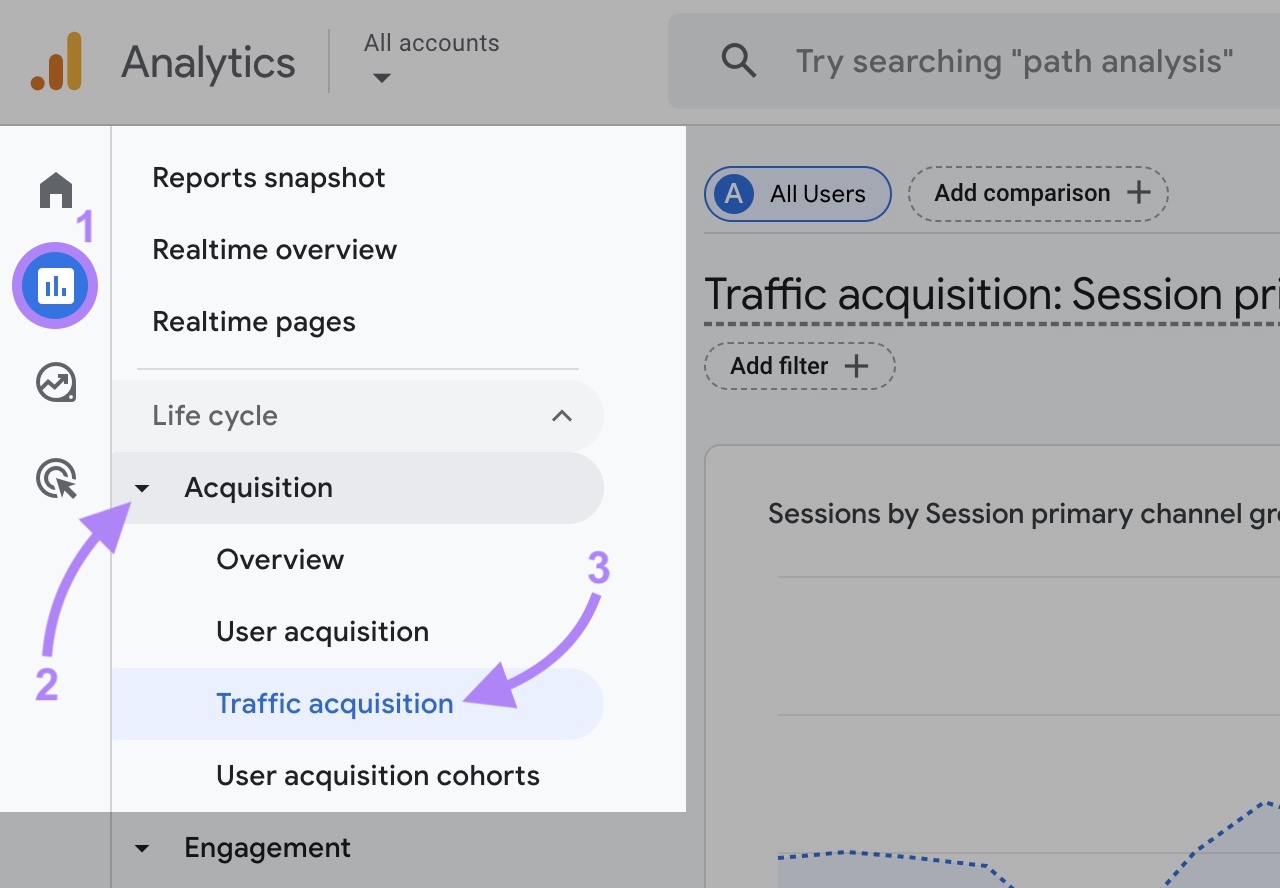
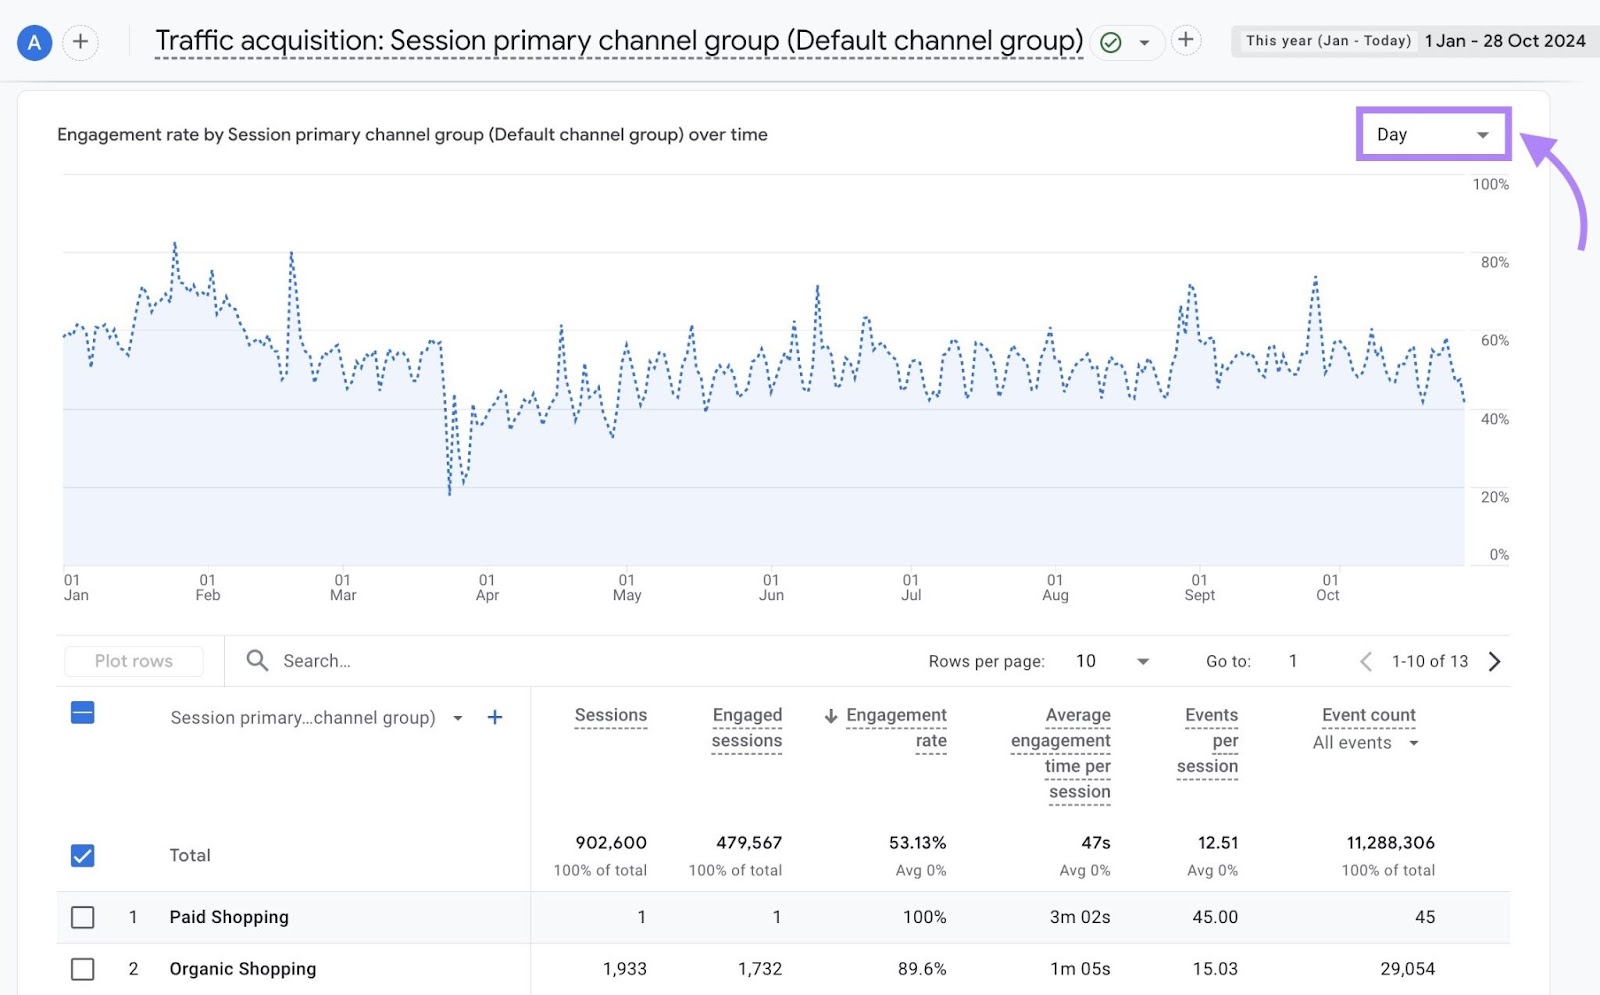
You’ll see the following report that shows how your website acquires visitors (indicated as “Sessions”).
The small drop-down arrow to the left of the “Sessions” column header indicates that this metric is sorting the data table and is what’s being displayed in the graph.

Click to the left of “Engagement rate” to sort by that metric instead.
Now, uncheck all the boxes except for the one to the left of “Total.” Then click the “Plot rows” button.
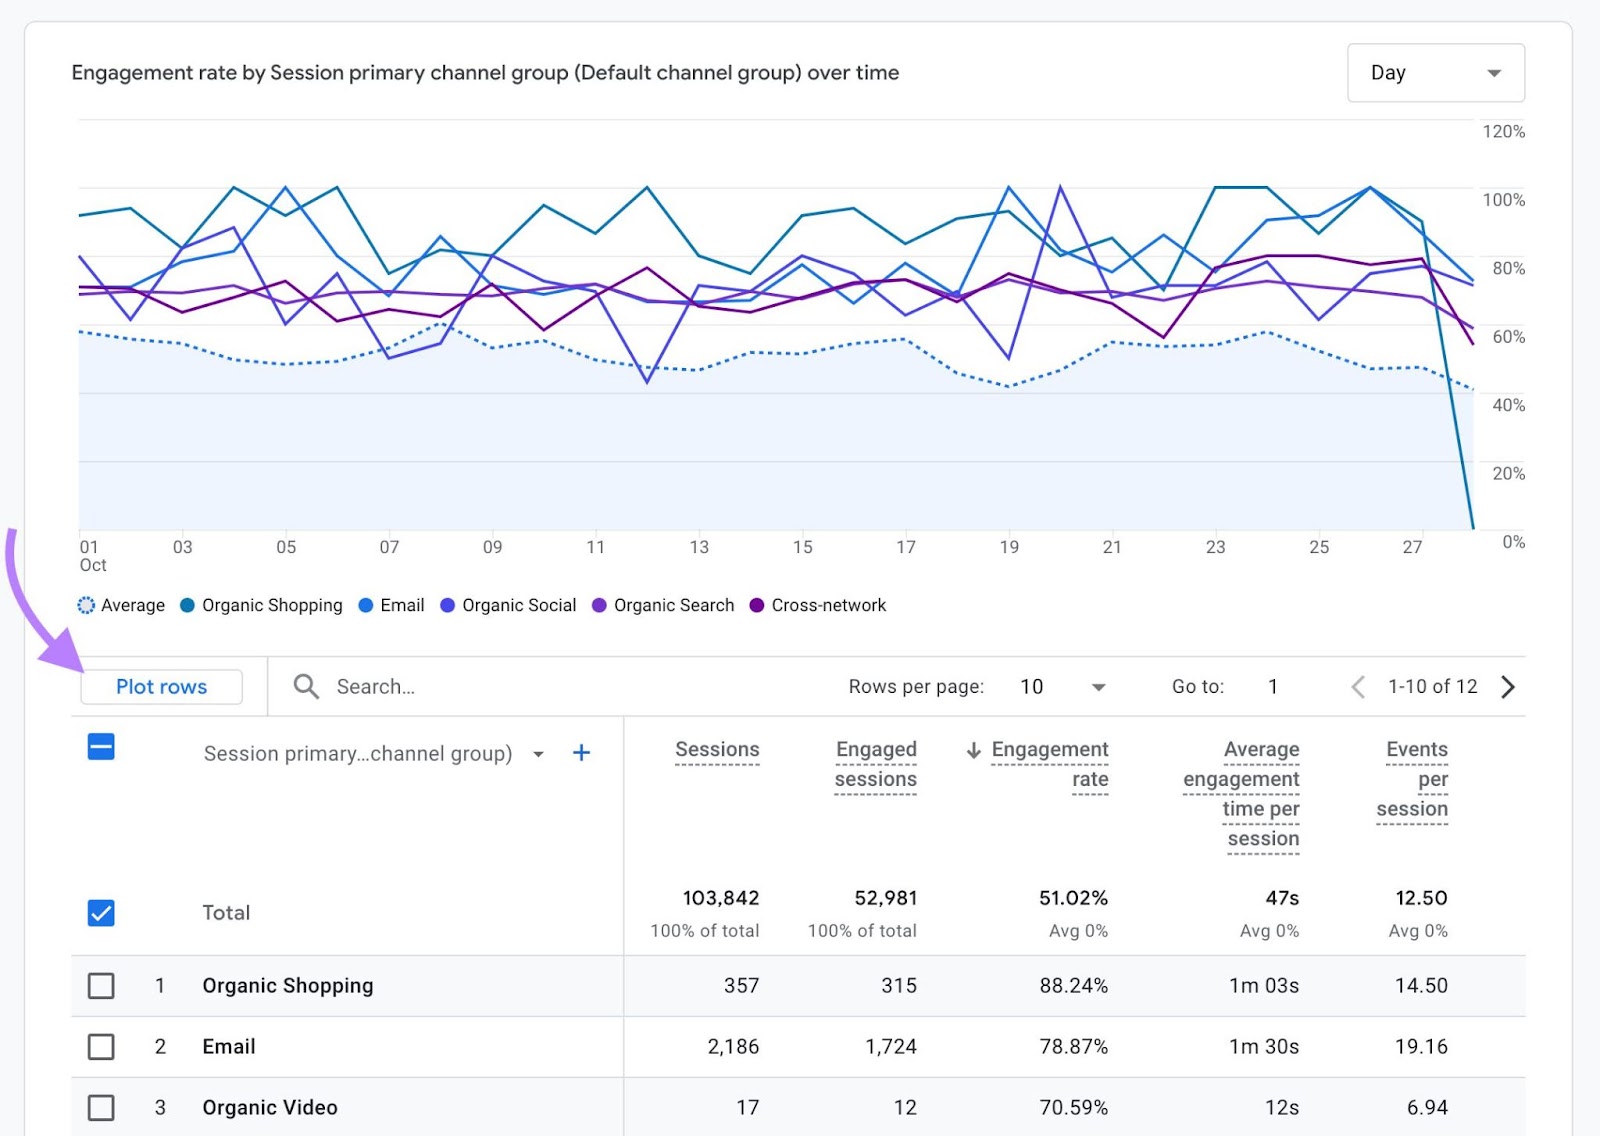
You’ve built a graph that displays the total engagement rate of your whole site over time. And you can click on the date range in the upper right to analyze specific periods you’re interested in.

A box appears where you can select your date range. You can manually enter the date range you’d like to view or choose from the list of predefined date options.
Click “Apply” when you’ve selected your desired range.
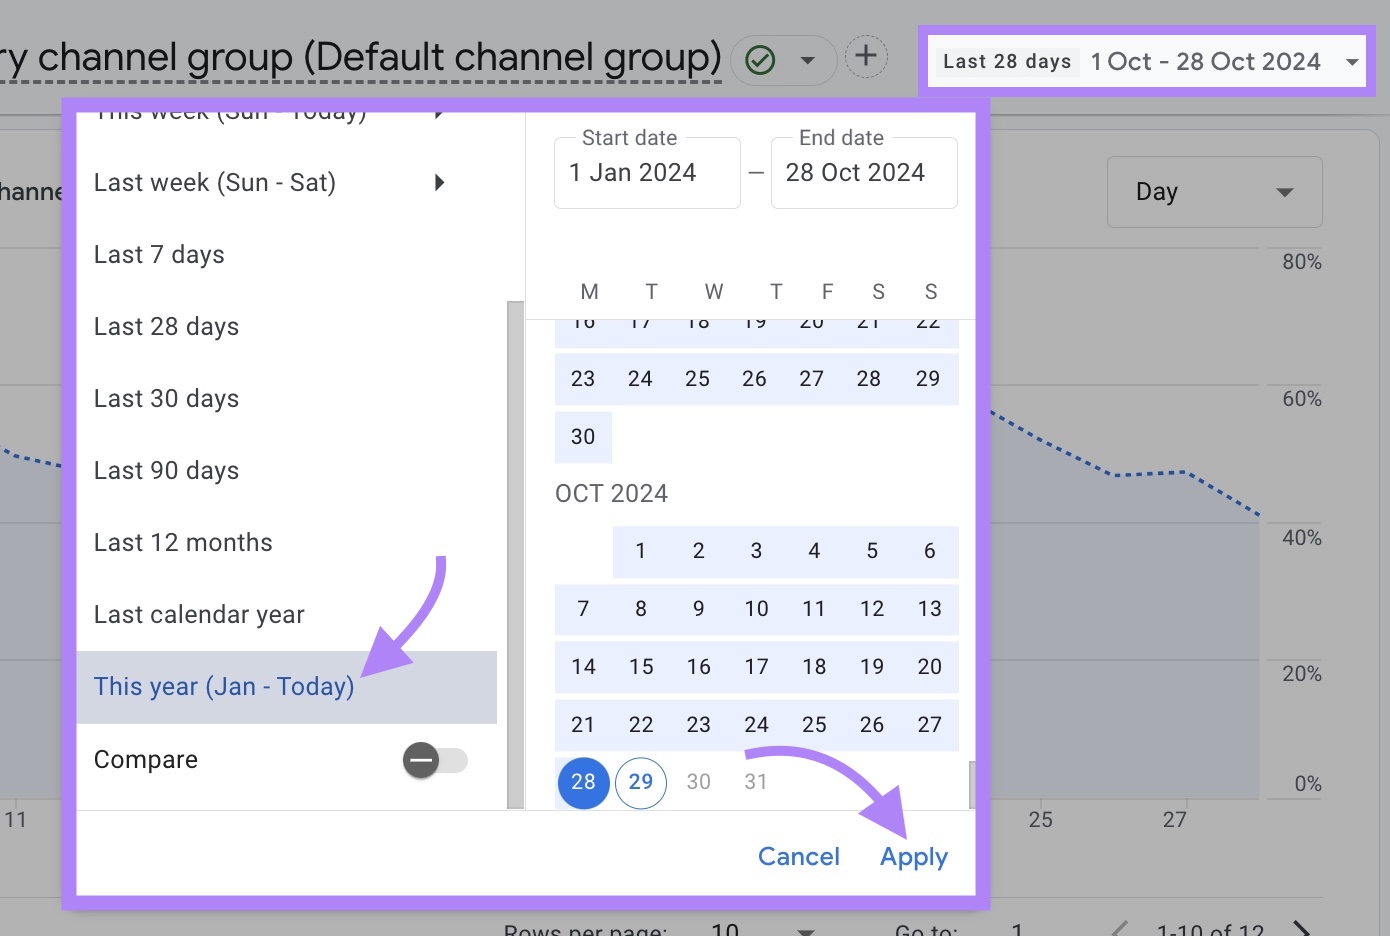
Your engagement rate graph will rebuild.
For further customization, click the box below the data range selector to choose whether to graph your engagement rate data at the daily, weekly, or monthly level.
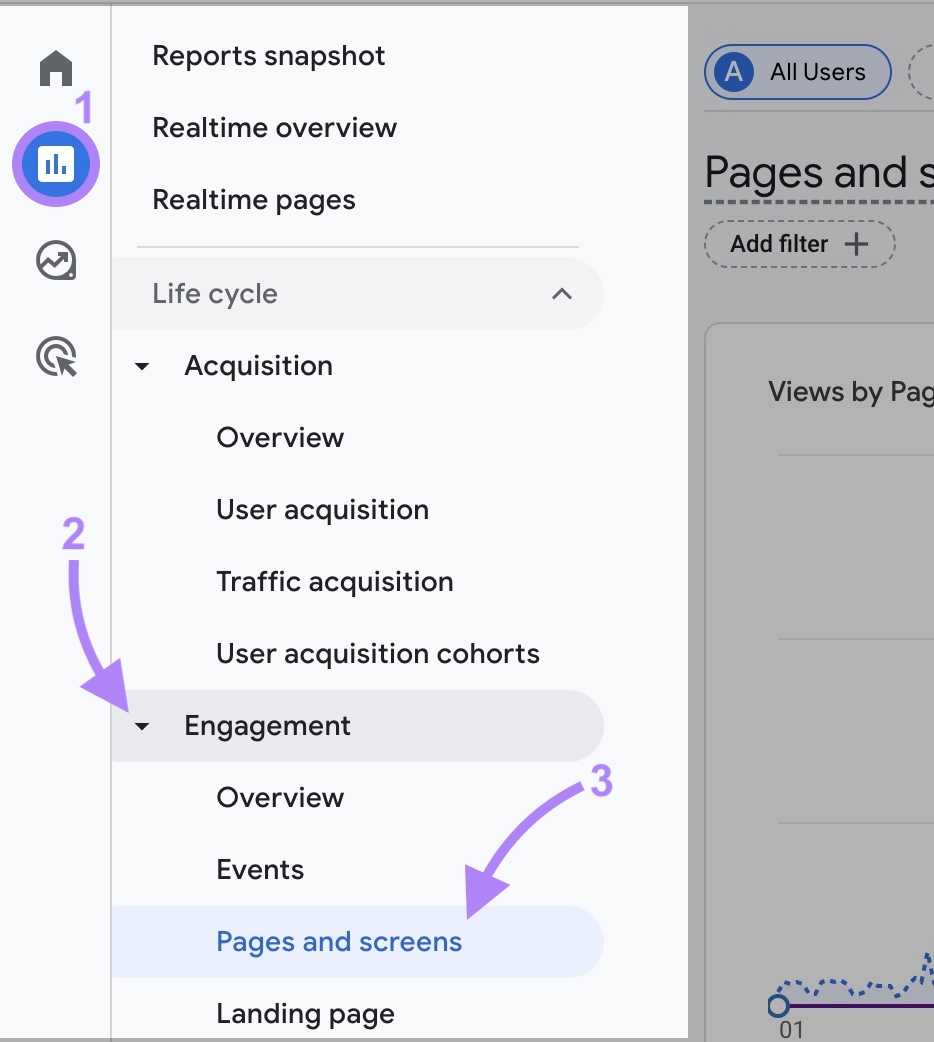
To see your page-level engagement rate, go to “Reports” > “Engagement” > “Pages and screens.”
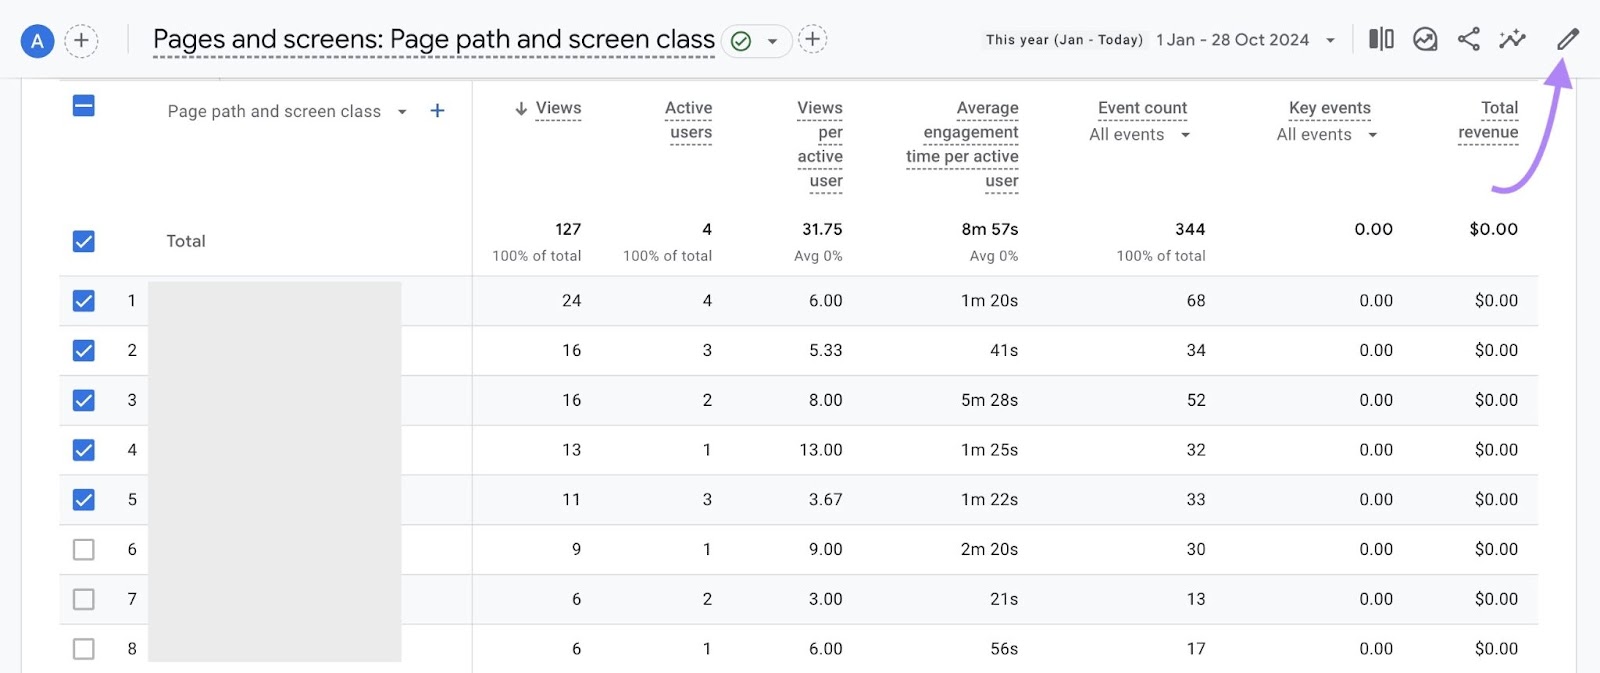
You’ll see a report like this showing your top pages.
Click the pencil icon in the upper right corner to customize the report and add engagement rate (GA4 will then always show that metric in this report).
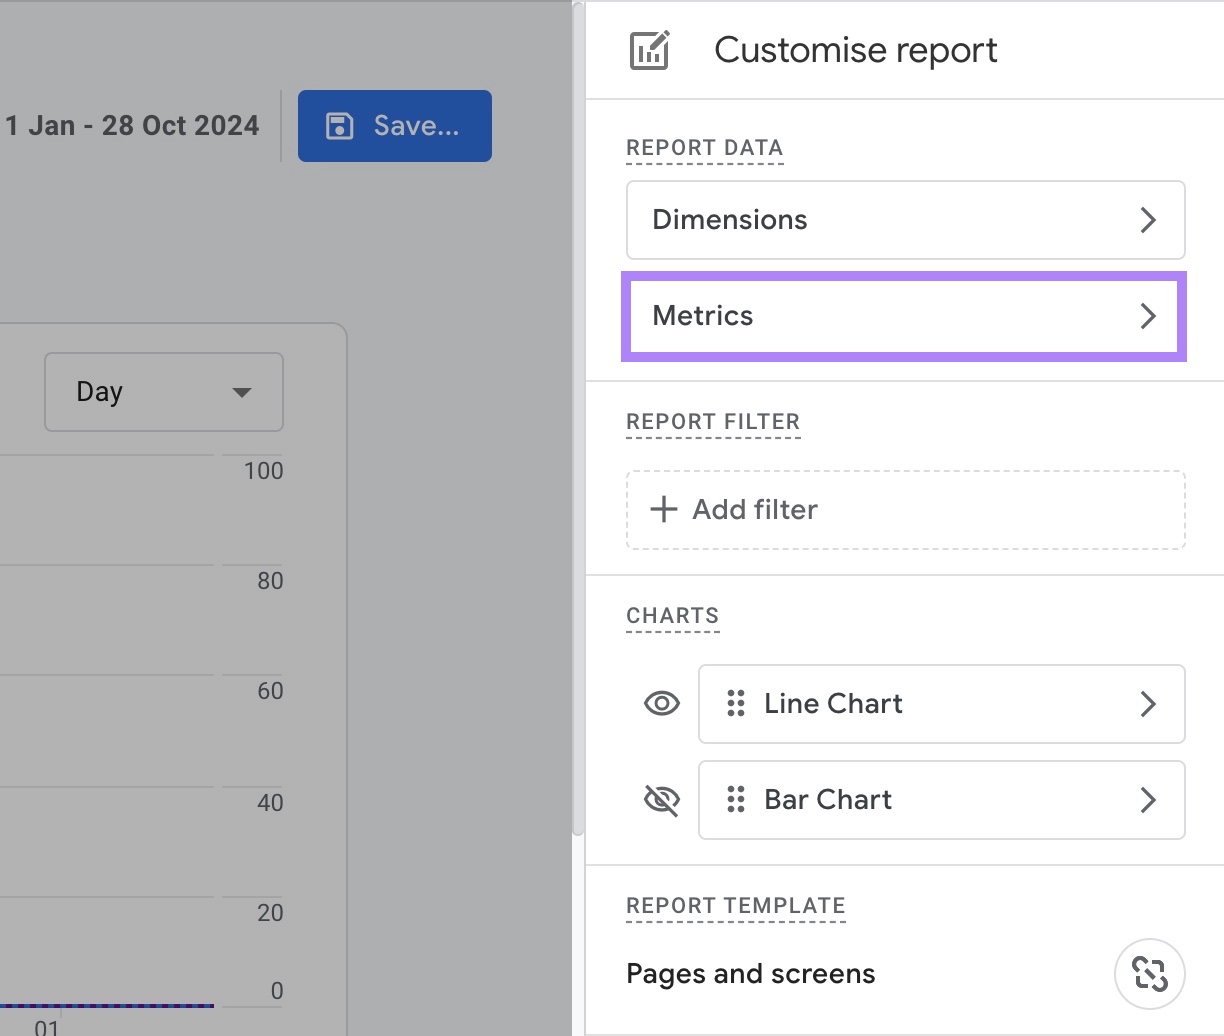
Now, click “Metrics.”
You’ll see the list of metrics available in your report.
Click “Add metric,” begin typing “Engagement rate” and select it in the drop-down once it is available.
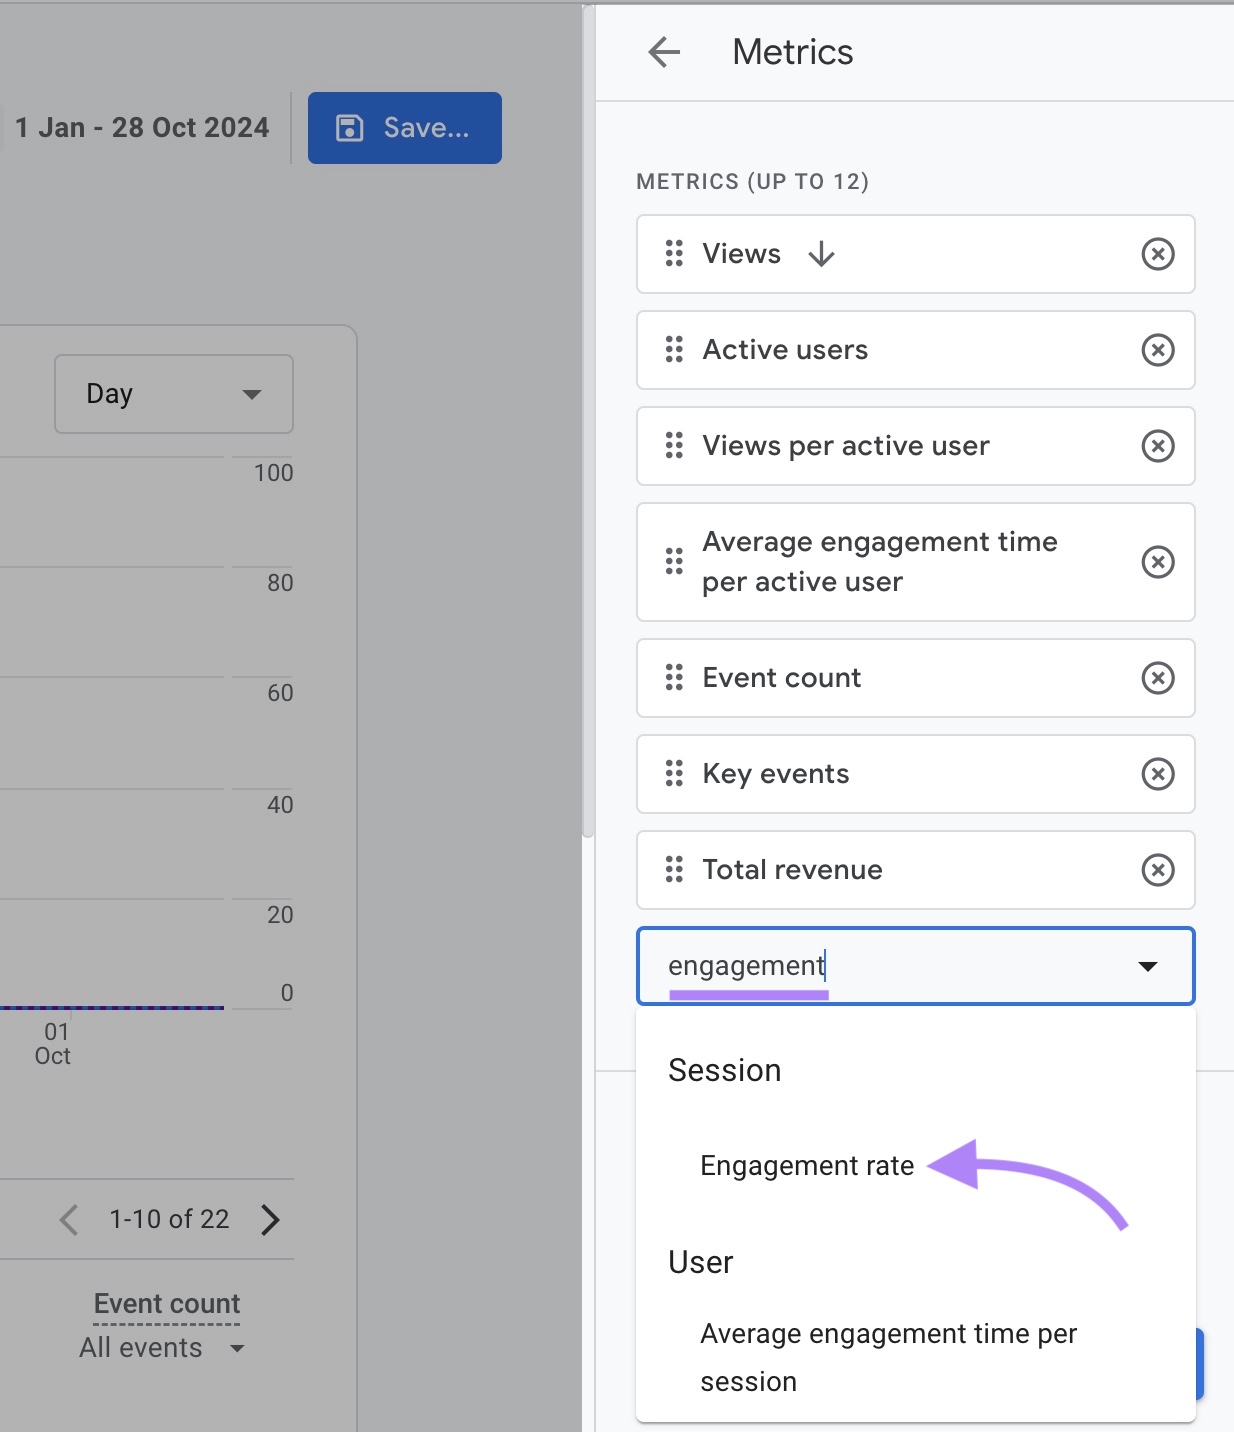
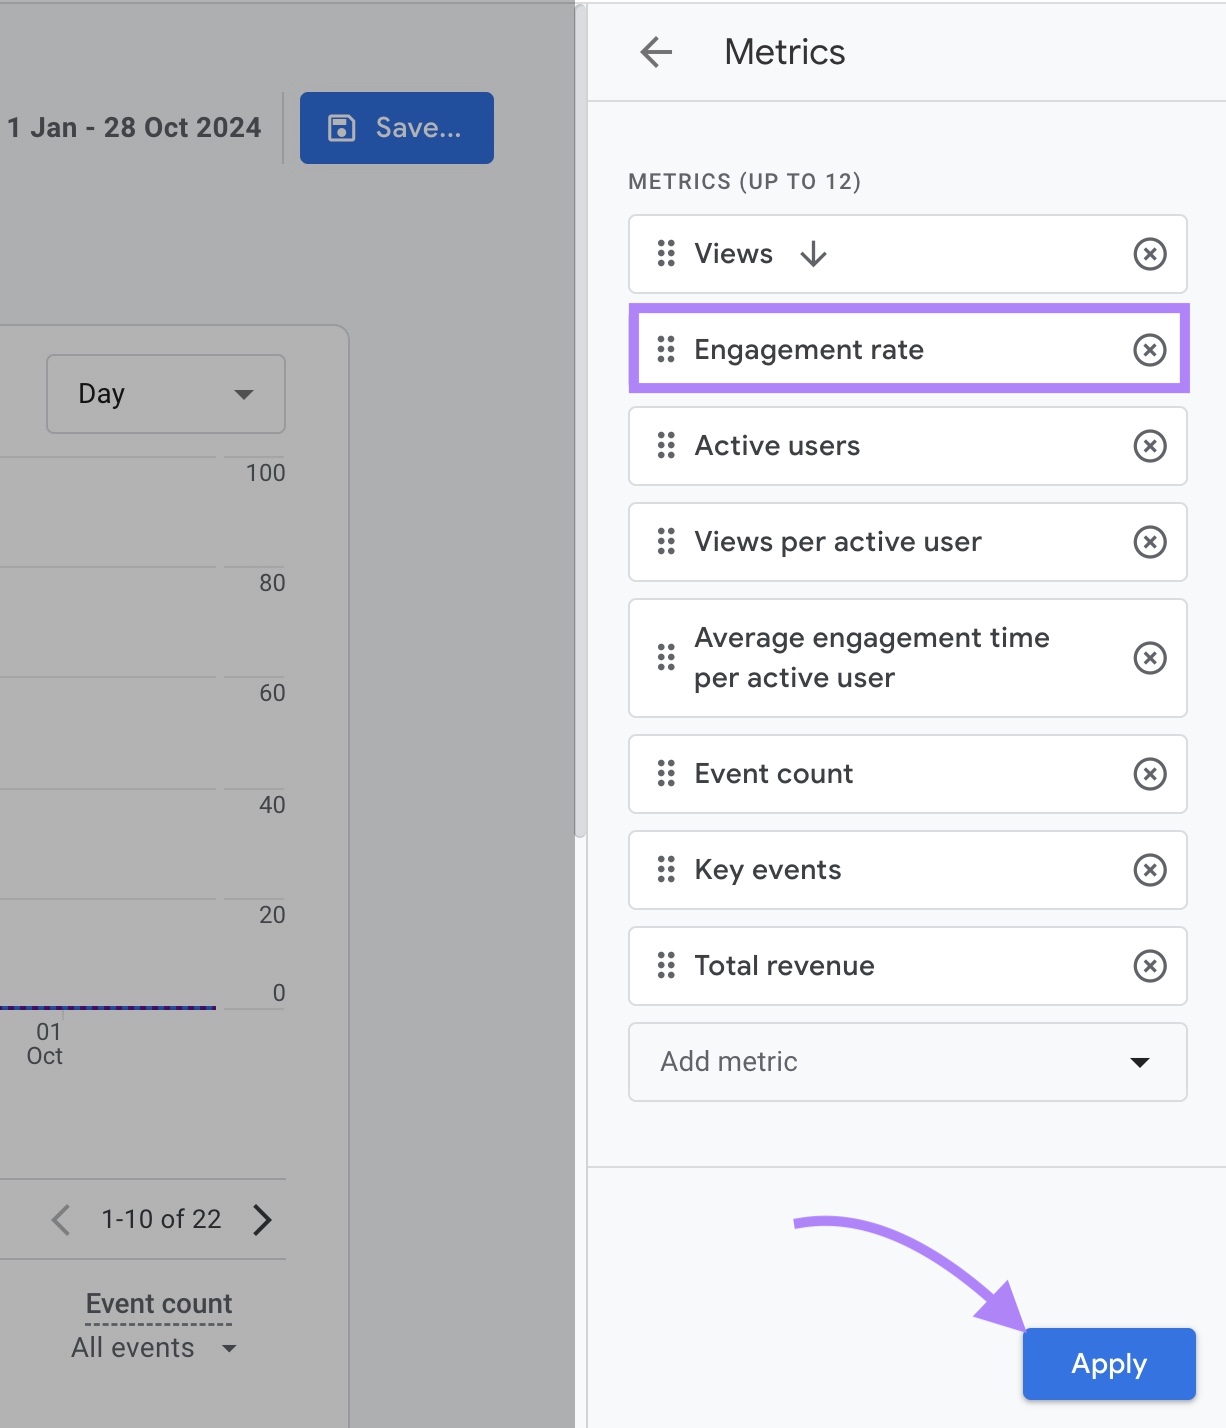
Once you’ve added engagement rate to the report, click and hold the “Engagement rate” metric and drag it toward the top of your list of metrics and place it just below “Views.”
Now, click “Apply.”
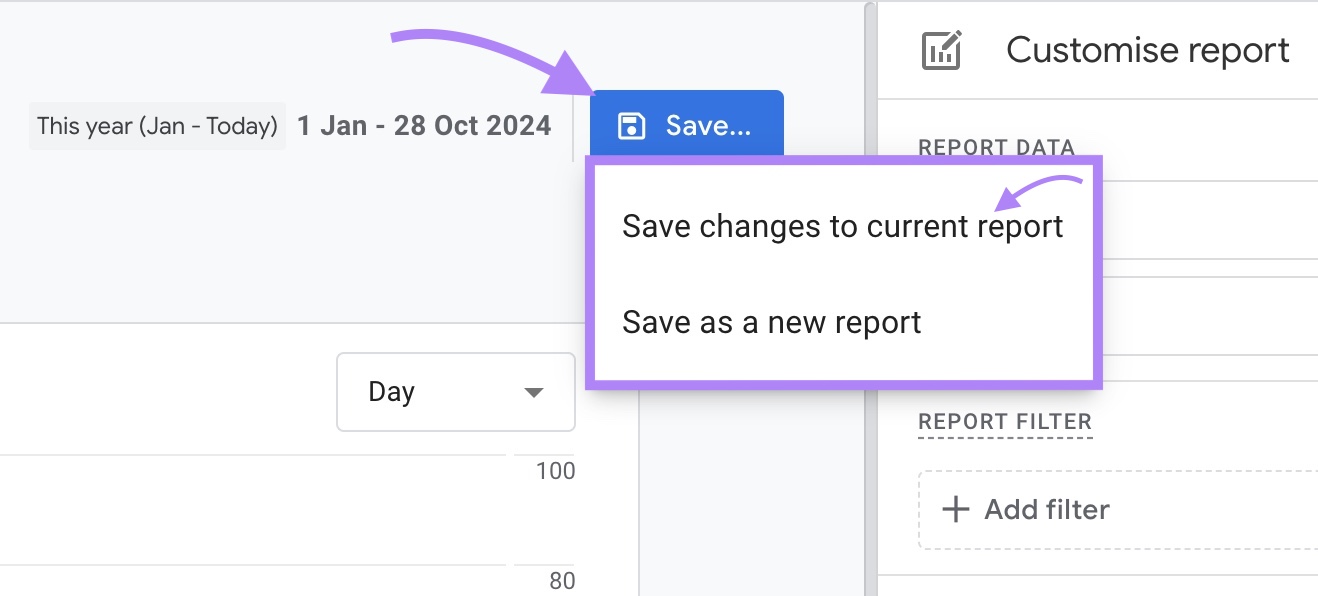
Click “Save” followed by “Save changes to current report” at the top of your report to make the change permanent.
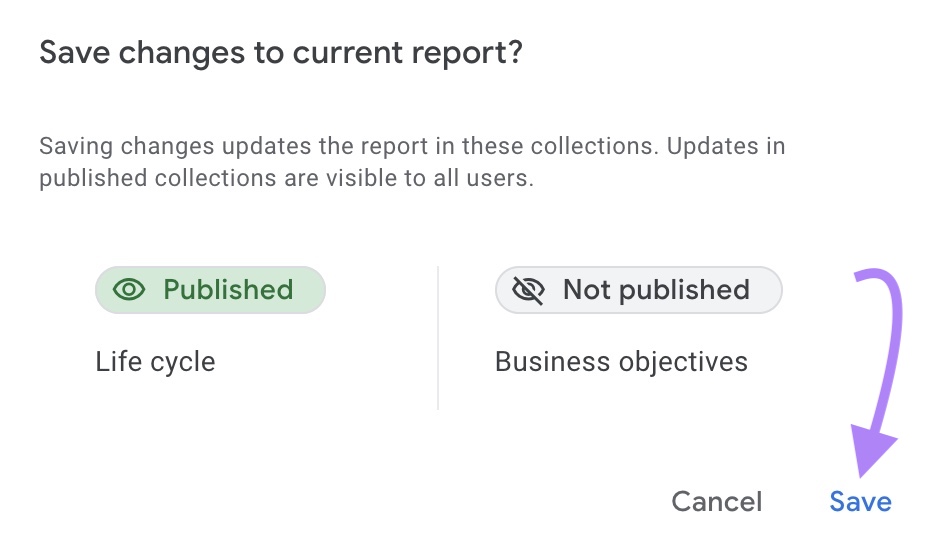
And click “Save” again.
Now that you’ve added engagement rate, Google Analytics enables you to compare performance across pages.
4 Ways to Improve Your Engagement Rate
A healthy engagement rate makes for a healthy website that can turn visitors into customers.
Here’s how to use engagement rate data to improve performance:
Improve Your Low-Engagement Pages
Now that you’re able to see engagement rates for different URLs, focus on pages that are viewed often but have low engagement rates. These represent great opportunities to improve your entire site’s performance.
In the table below, you can see that the second and third pages listed have engagement rates far lower than the site’s average.
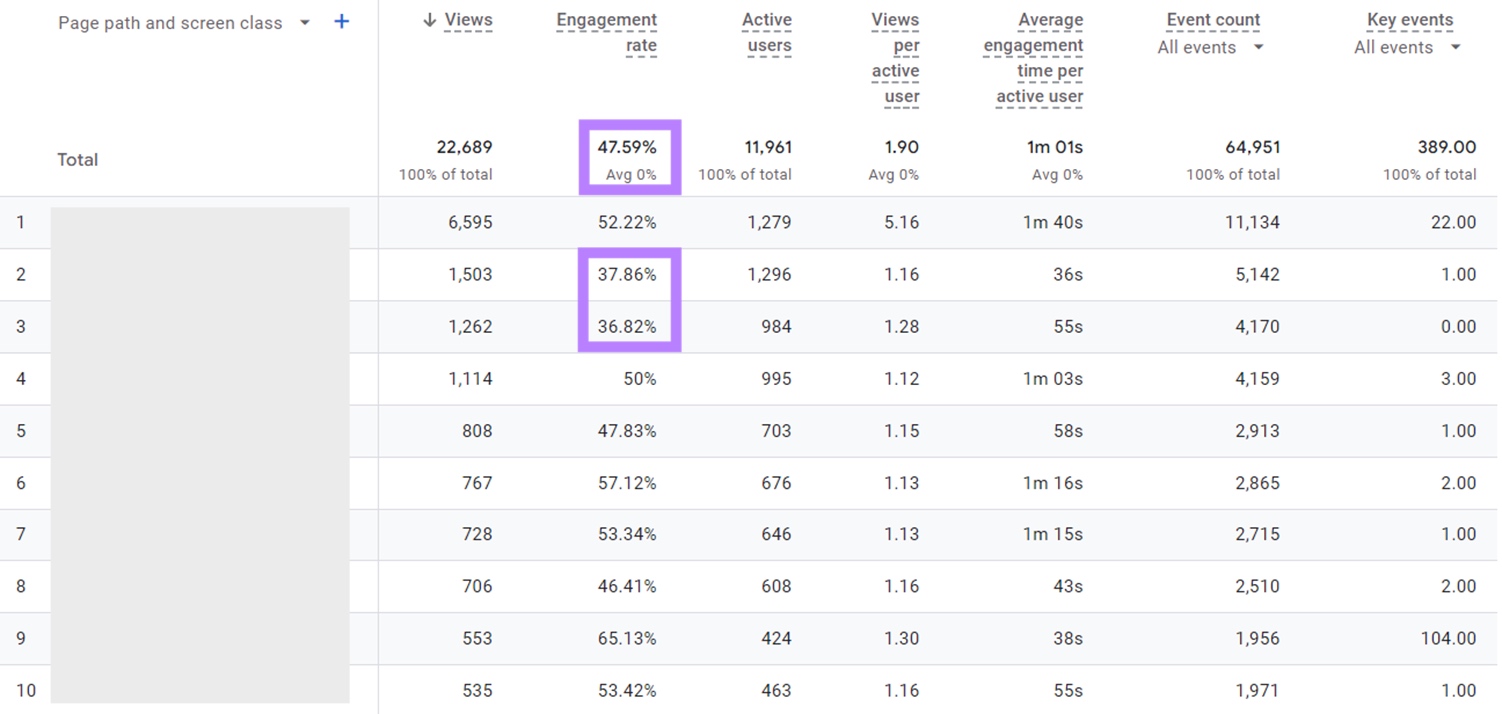
Once you spot candidates like these for improvement, it’s time to fix them.
Visit those pages and study them carefully. To identify potential pain points your visitors are facing.
Based on what you see, you could:
- Update your H1 to make sure it accurately reflects your page
- Revise your introduction to make sure it’s as short and helpful as possible. You can even remove it entirely if it doesn’t add value.
- Add images and increase whitespace. Pages with a high text density tend to have low engagement.
- Add relevant calls to action (CTAs) on the page. Keep in mind that a click to another page on your site automatically makes a session engaged. And review your links’ anchor text, so they grab attention.
As you implement page-specific enhancements, you’ll see engagement rates climb.
Fix Technical Website Problems
Technical issues like broken links or slow page speed can keep your visitors from having a positive interaction with your site. Which means fixing these kinds of problems leads to higher engagement rates and happier visitors.
How do you discover these problems?
With Site Audit.
This tool performs over 140 checks to analyze your website’s health. And you can even set up automatic crawls on a daily or weekly basis.
It catalogs your website problems into errors (the most important to fix), warnings, and notices. And it includes the “Site Performance” report (click “View details” to go to it), which shows you how to improve your site speed.
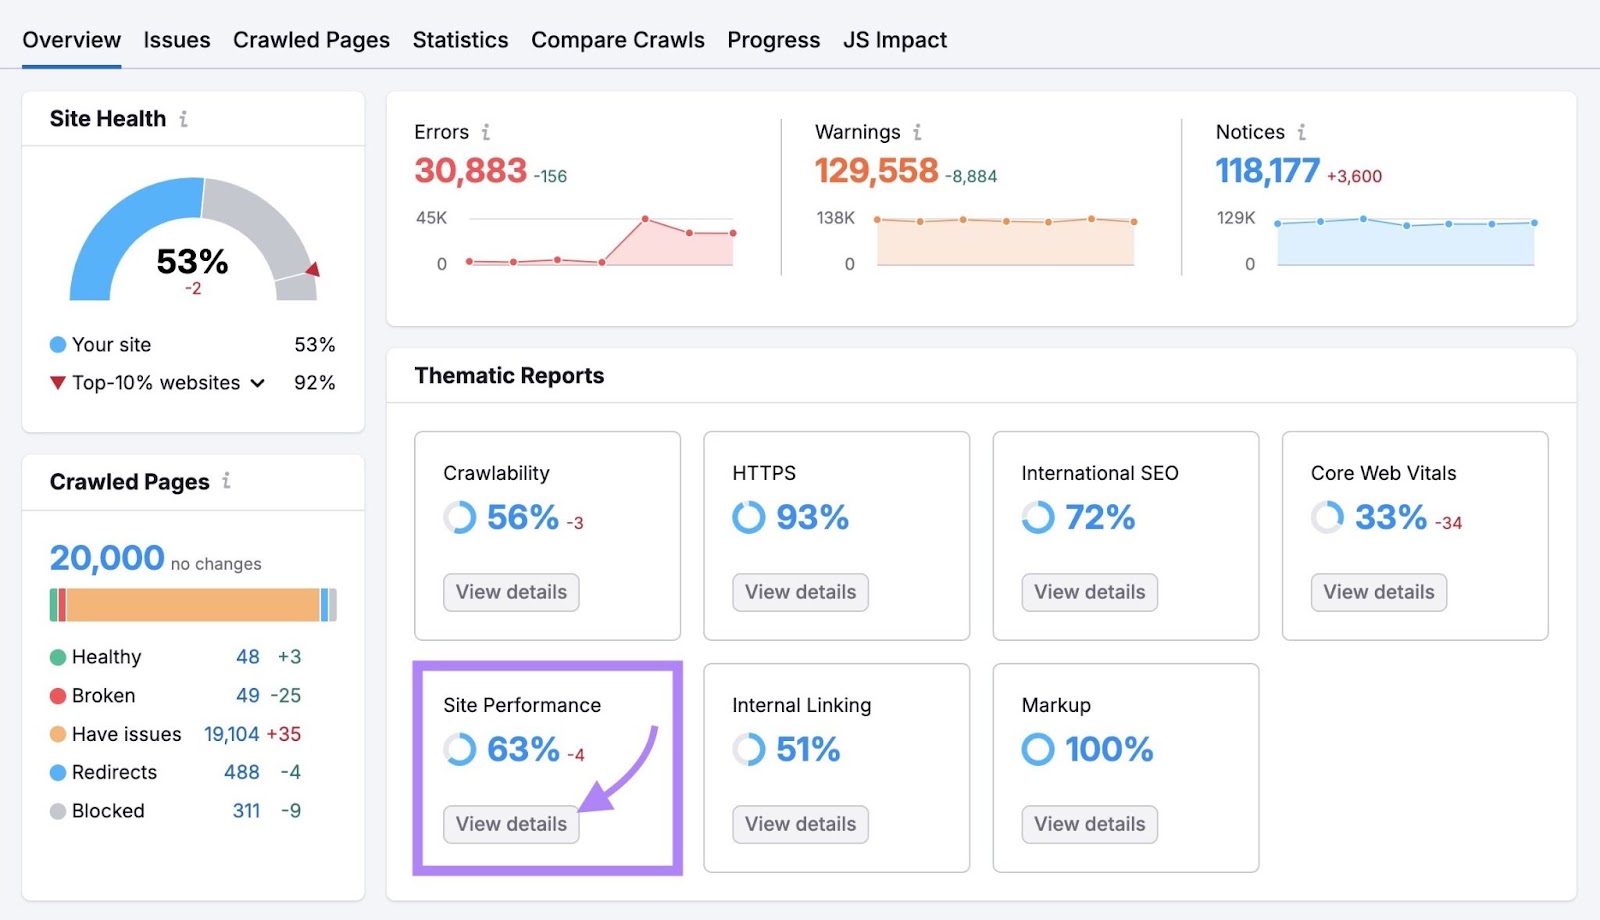
It groups those performance opportunities into the same errors, warnings, and notices categories. And keeps track of your average page load speed over time, so you can see your average page speed increase as you implement fixes.
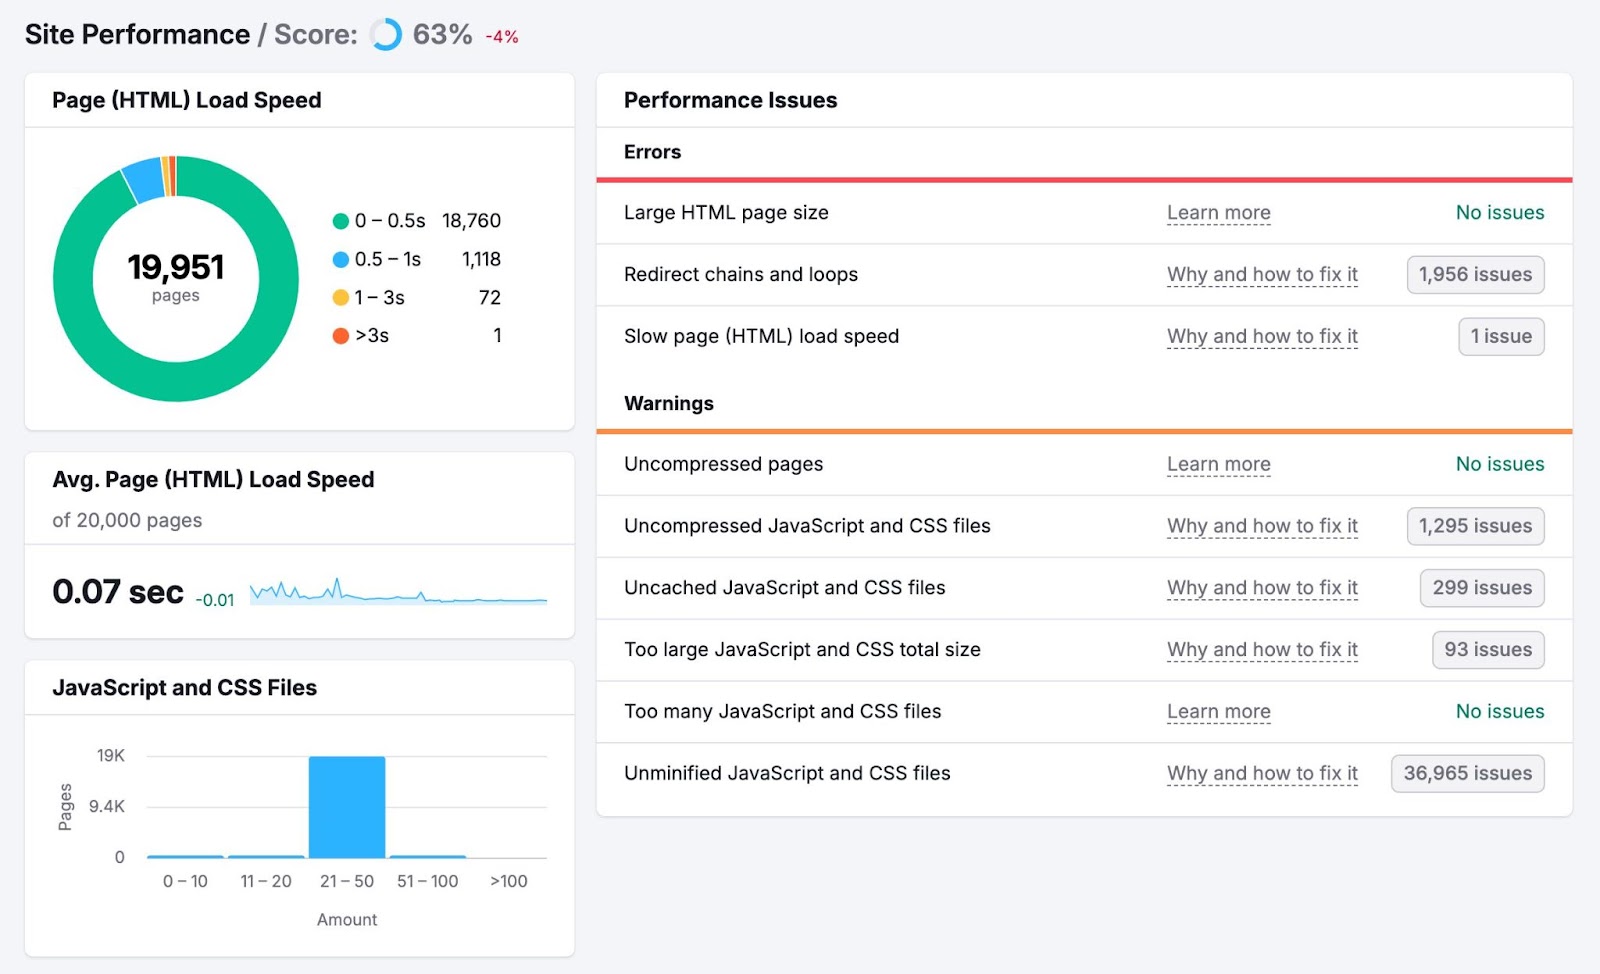
Faster site speed is better for the user experience (UX), and improved UX can help SEO. So, you could be helping more visitors to find your site.
Create New, Relevant Content
Publishing for the sake of publishing is unlikely to lead to positive results. But focusing on new content centered on topics your target audience actually cares about is a great way to get more organic traffic and boost engagement.
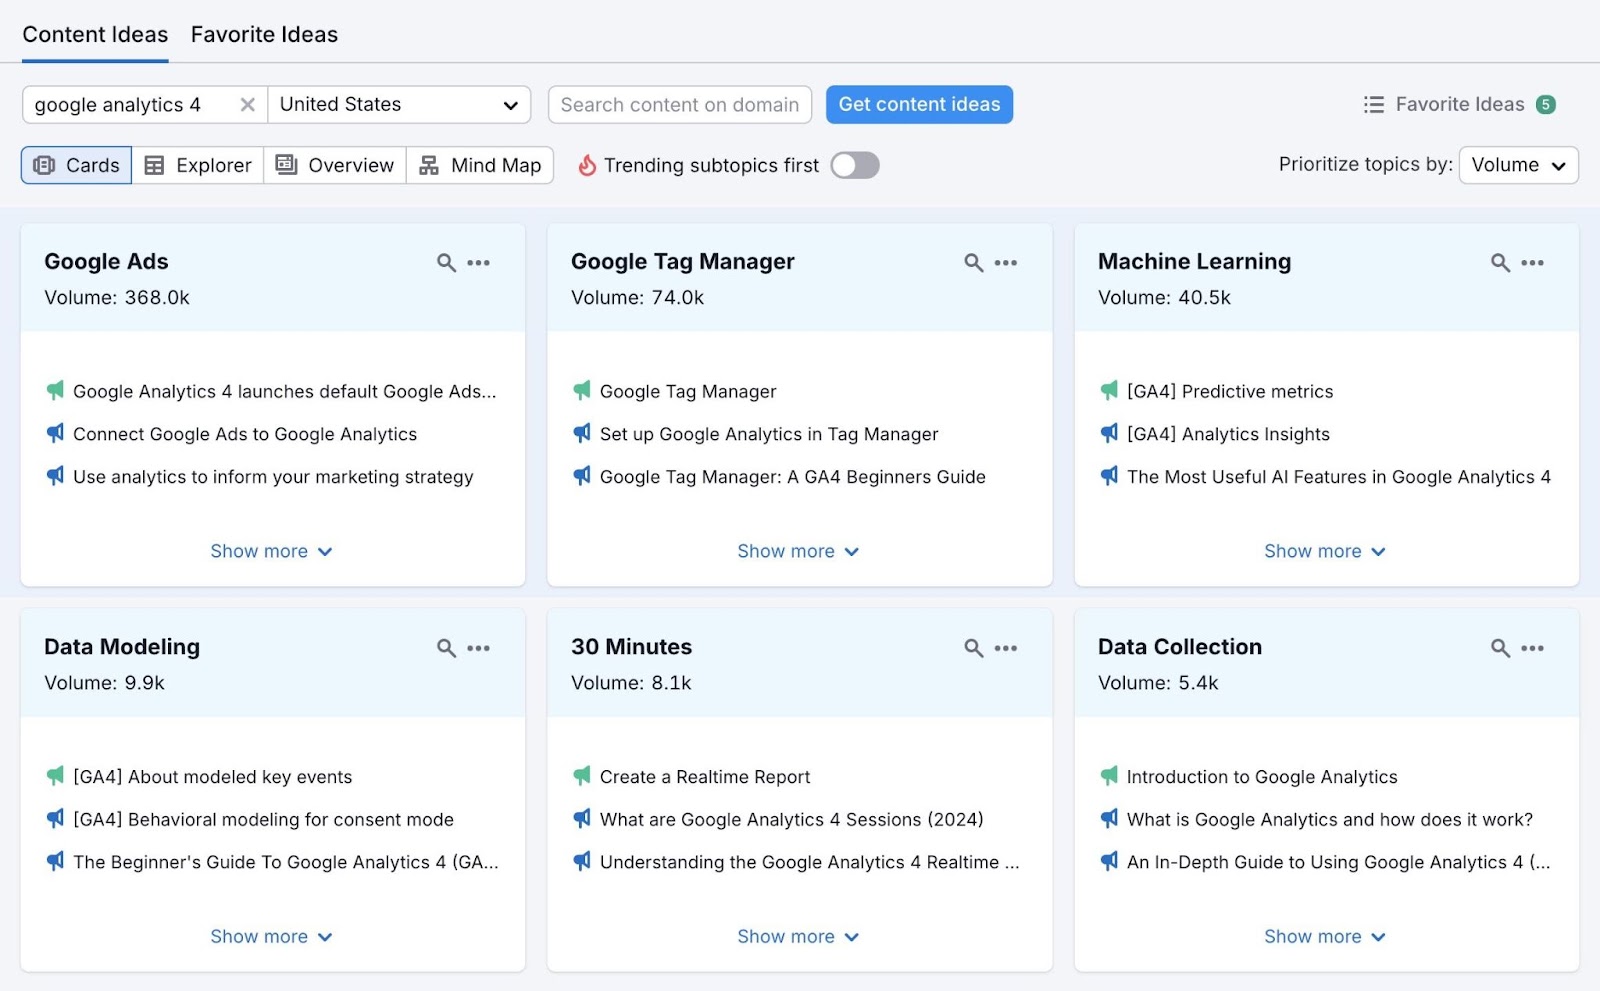
Use Topic Research to generate content ideas.
Just enter a general topic your business is focused on and click “Get content ideas.”
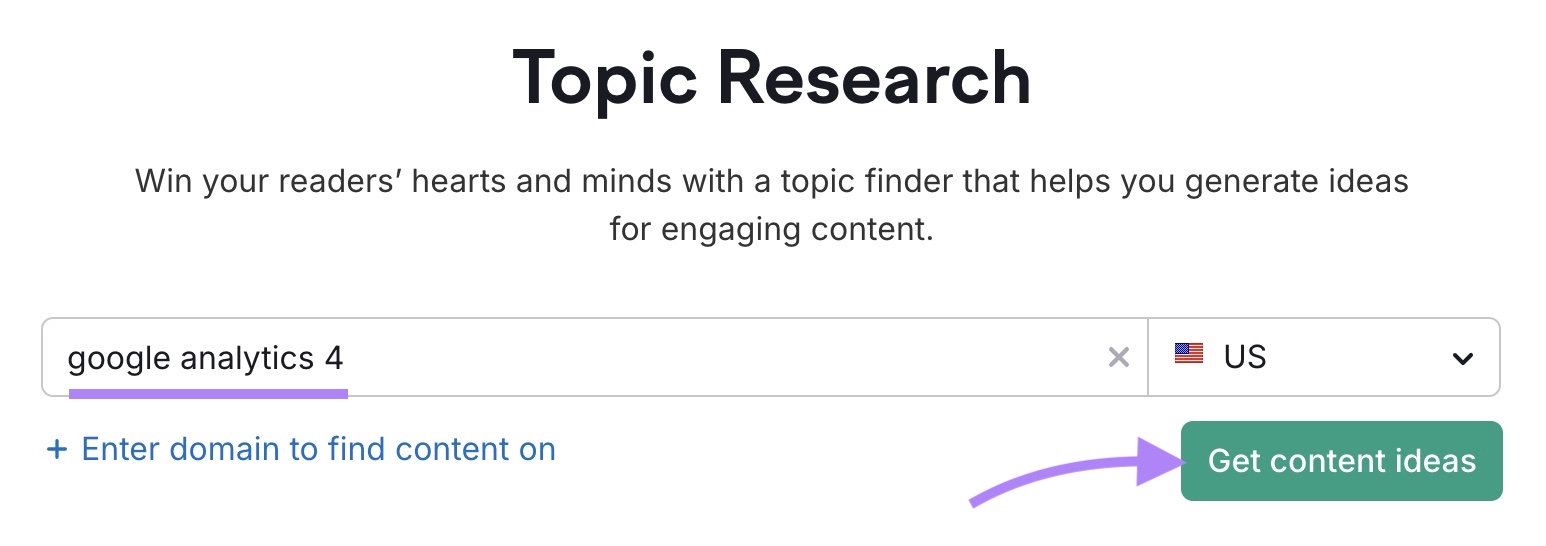
Here, you can see a bunch of related subtopics. Along with information about the keyword search volume, top headlines, etc., for each subtopic.
Keep an eye out for any cards that are green rather than blue. They represent topics with high topic efficiency—which measures search volume relative to ranking difficulty to help you find promising opportunities.
And keep search intent (what the user is trying to achieve with their search) in mind, so you can write with an eye toward what your audience is looking for.
Make Sure All Your Content Is High Quality
High-quality content is accurate, clear, and helpful to your audience. And it’s key for keeping your audience interested.
SEO Writing Assistant (SWA) can help you create great content.
It grades your writing for readability, originality, tone of voice, and SEO. And comes with AI features to help rephrase and compose your text—which you can then review and adjust to save time while you write.
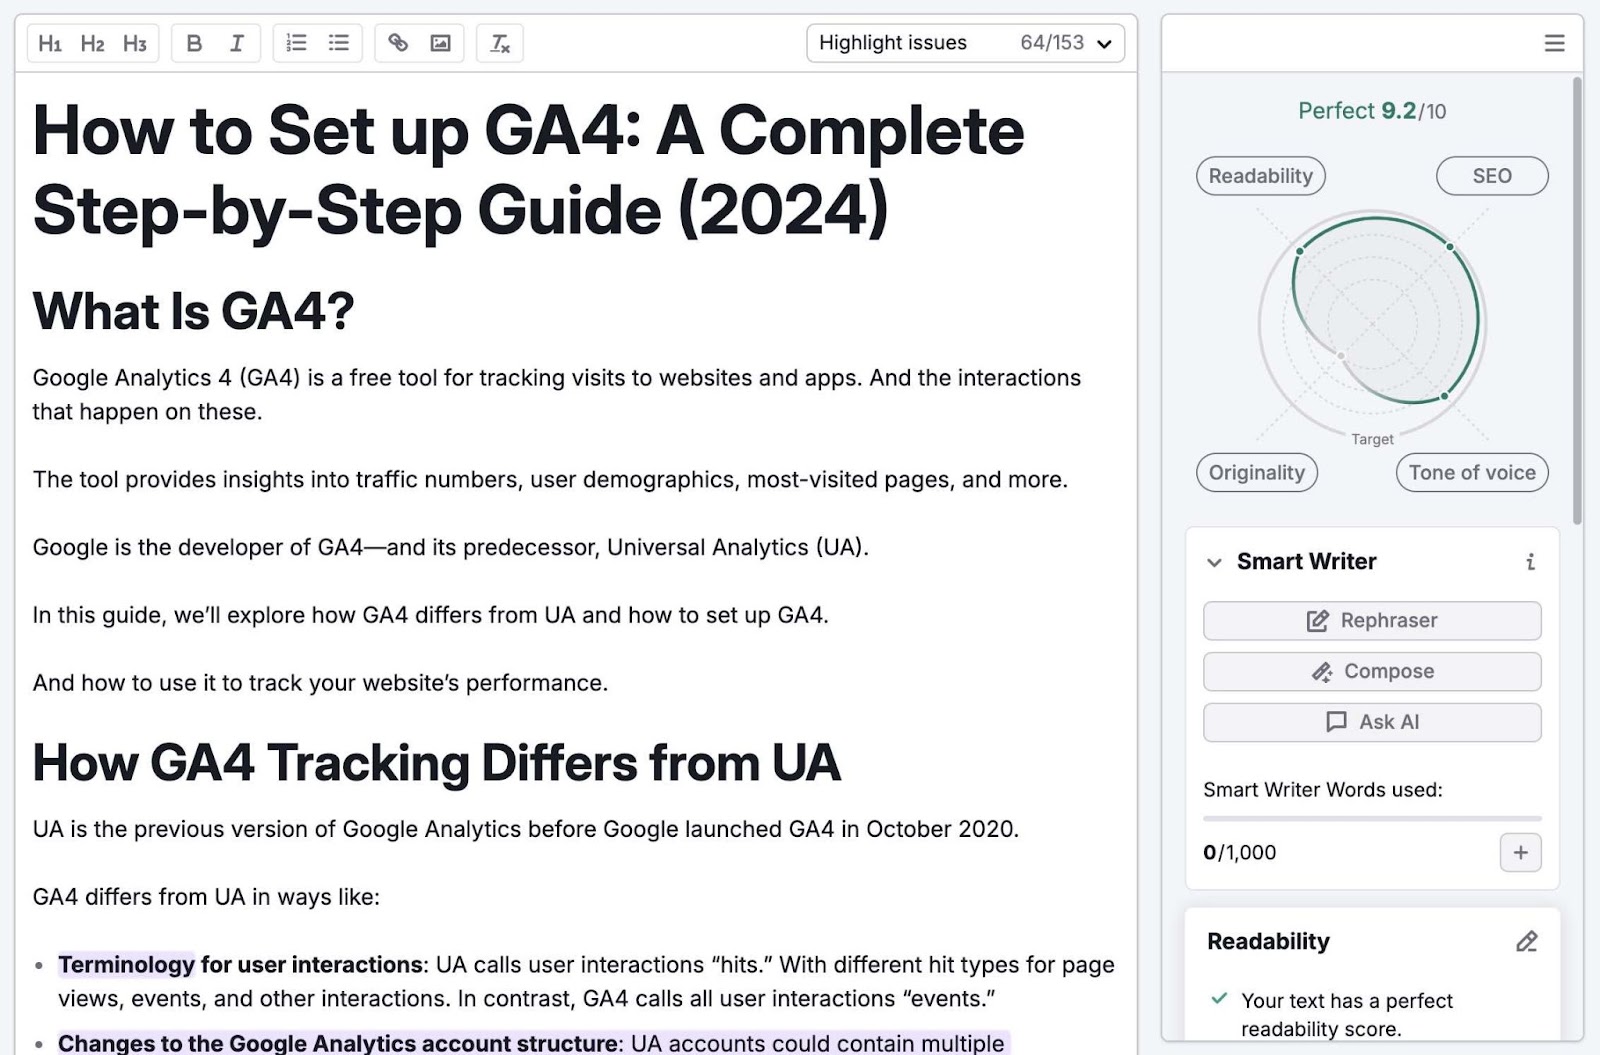
You can also use the SEO Writing Assistant to improve existing pages that need complete rewrites. Copy the text into SWA and use the AI Smart Writer features to improve your content quality and possibly boost engagement.
Make Your Site More Engaging
An engaging website makes it easy for visitors to interact in ways that lead to conversions, which means it ultimately benefits your business.
Semrush offers a variety of tools that make it easy to create new, high-quality content and improve your existing pages, both of which will likely improve your average engagement rate.
Ready to try it out?
Start your free trial today.
