After about four months without any core updates, Google announced its November 2021 broad core algo update on November 17, 2021:
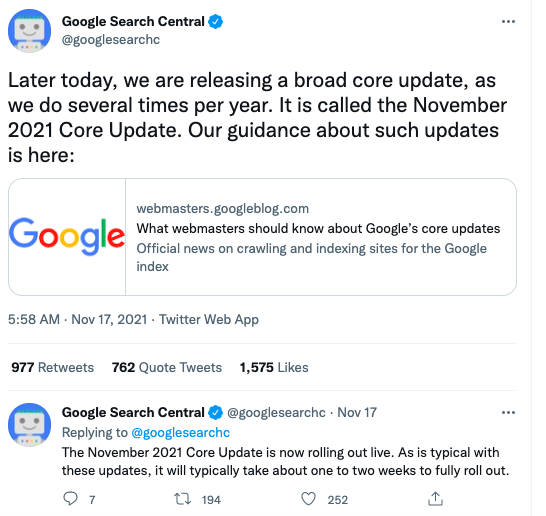
While Google itself confirmed that, as usual, we should give the update a week or two to fully roll out, we can already set some preliminary conclusions and start assessing the update’s aftermath.
November 2021 Core Update: The Initial Impact
Semrush Sensor went all red right on November 17, the first day of the algo update.
We saw a somewhat significant spike in volatility (Sensor’s average volatility was at a 9 out of 10 mark) that didn’t seem to last long. Only two days into the update, the overall SERP volatility scale looked as calm as if the storm had never taken place.
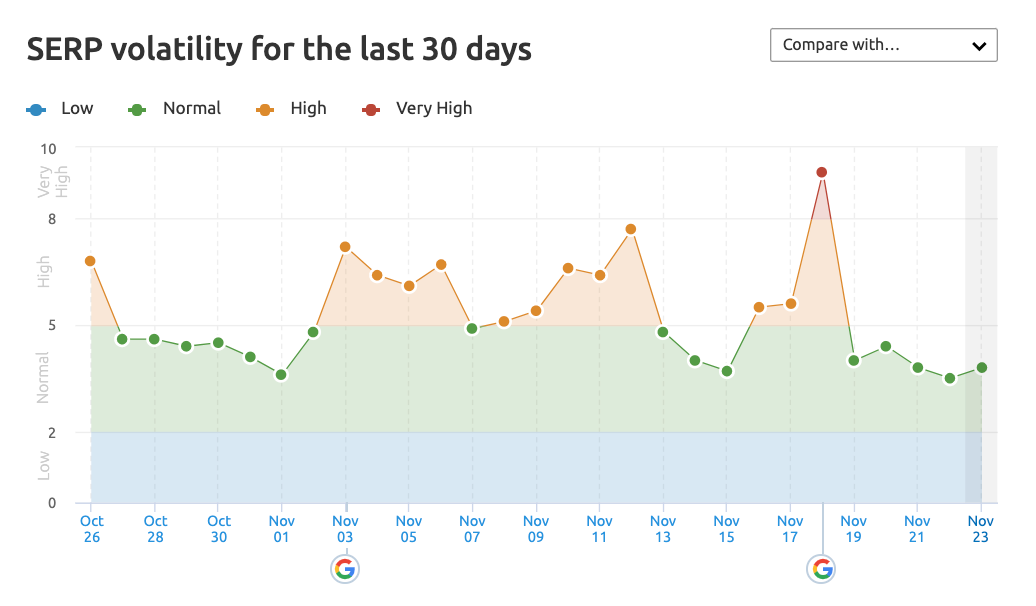
We saw a similar picture during the previous update in July, but this time, the return to “normal” came even faster.
We can’t be sure whether this implies that Google’s updates are getting less powerful, or we’re now in the calm before the storm. Read our latest write-up that analyzes and quantifies all the broad core algo updates for the past three years and tries to address these questions.
How Volatile Was the November 2021 Core Update?
Overall, the November update led to higher volatility than its July counterpart:
- Desktop SERPs underwent 12% more volatility;
- Mobile SERPs were 23% more volatile during the November update.
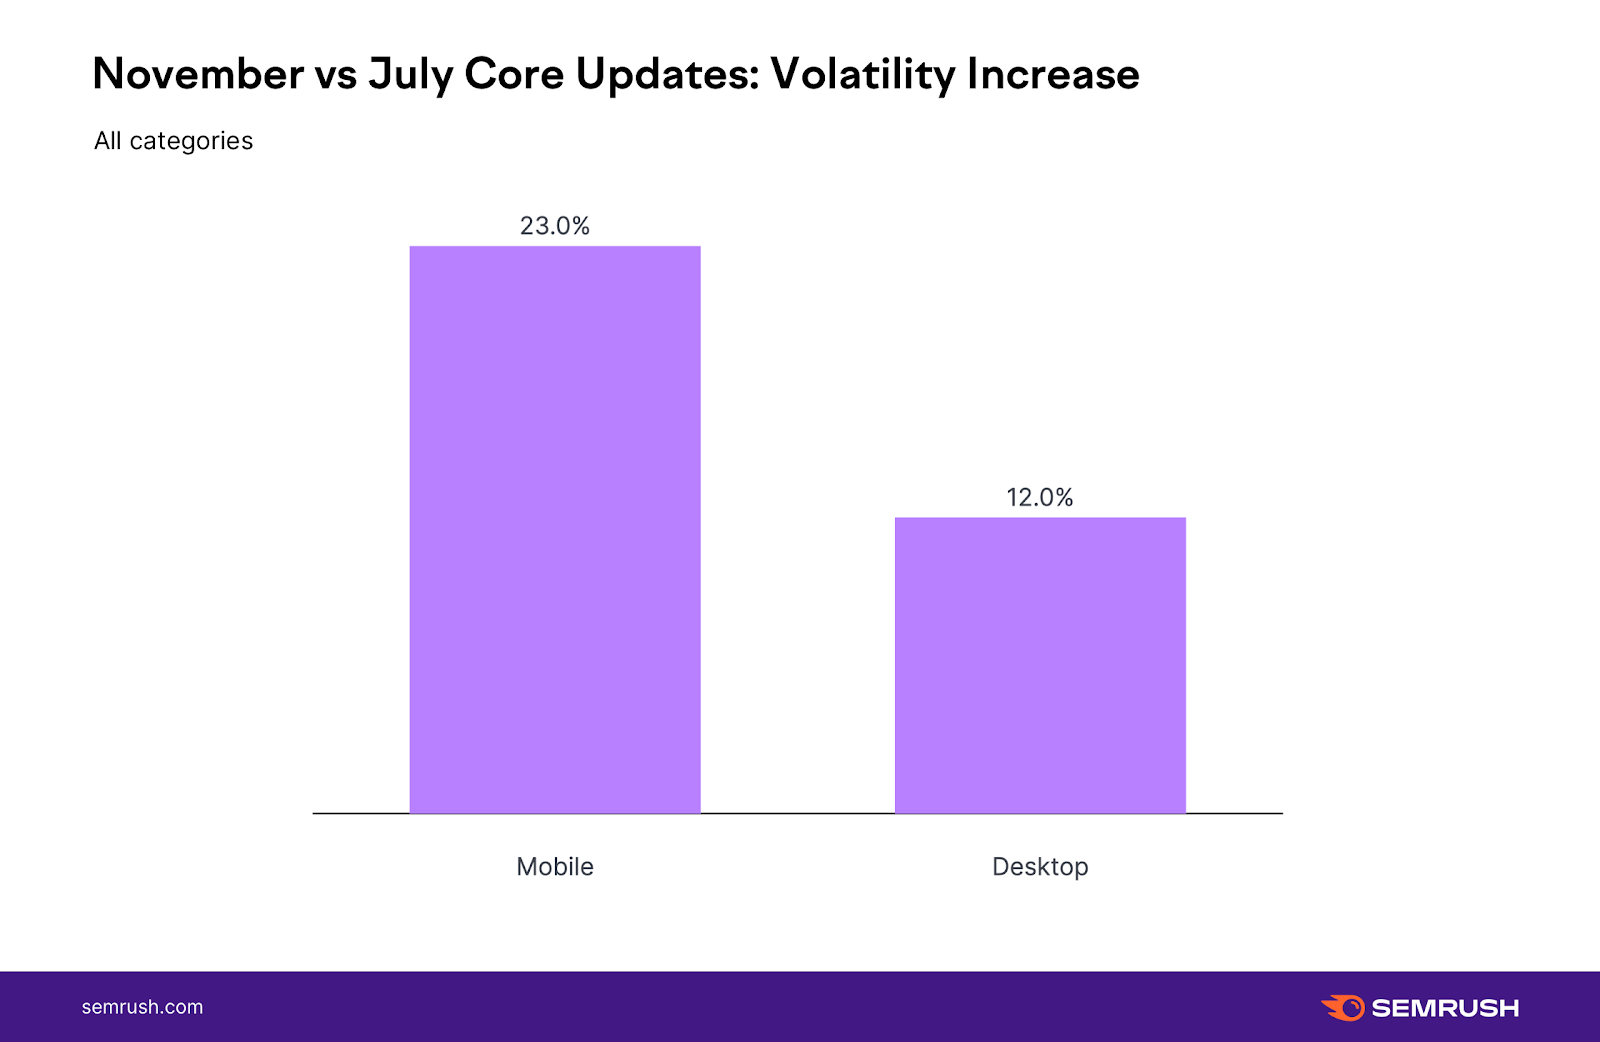
If you didn't see extensive volatility on desktop, there was a great propensity for mobile shifts, so make sure to check your mobile rankings as well.
On an industry level, the November update also looks more volatile. Out of the 17 analyzed verticals, 16 show higher volatility throughout this month’s update compared to July. And overall, the average volatility across the industries in November is 20% higher than it was in July.
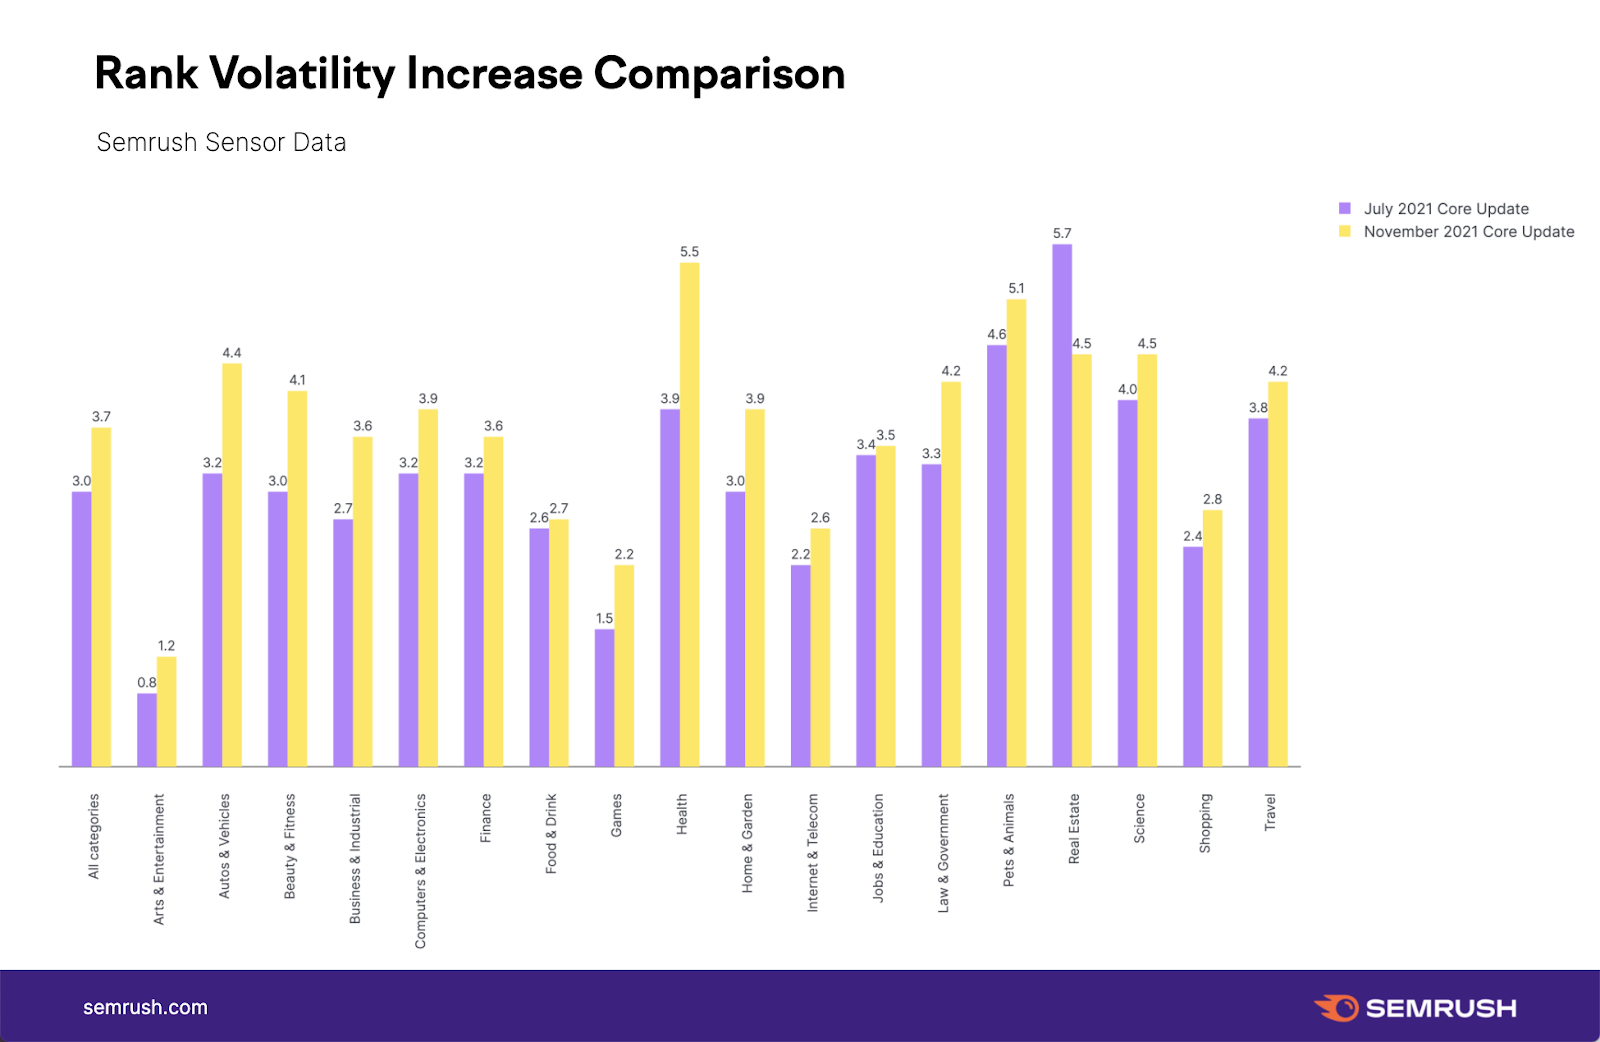
As with a good number of the core updates, the health industry was the hardest-hit niche during this update. Back in July, this was not the case, making November's volatility within the Health niche 41% higher on both desktop and mobile compared to July 2021.
The data also shows that a massive increase the real estate industry saw back in July 2021 was a bit of an aberration as the niche was far less volatile this time around.
If you leave the overall average aside, the average increase (i.e., only niches that showed an increase in rank volatility relative to the July update were analyzed) stands at:
- 31% on mobile SERPs;
- 22% on desktop SERPs.
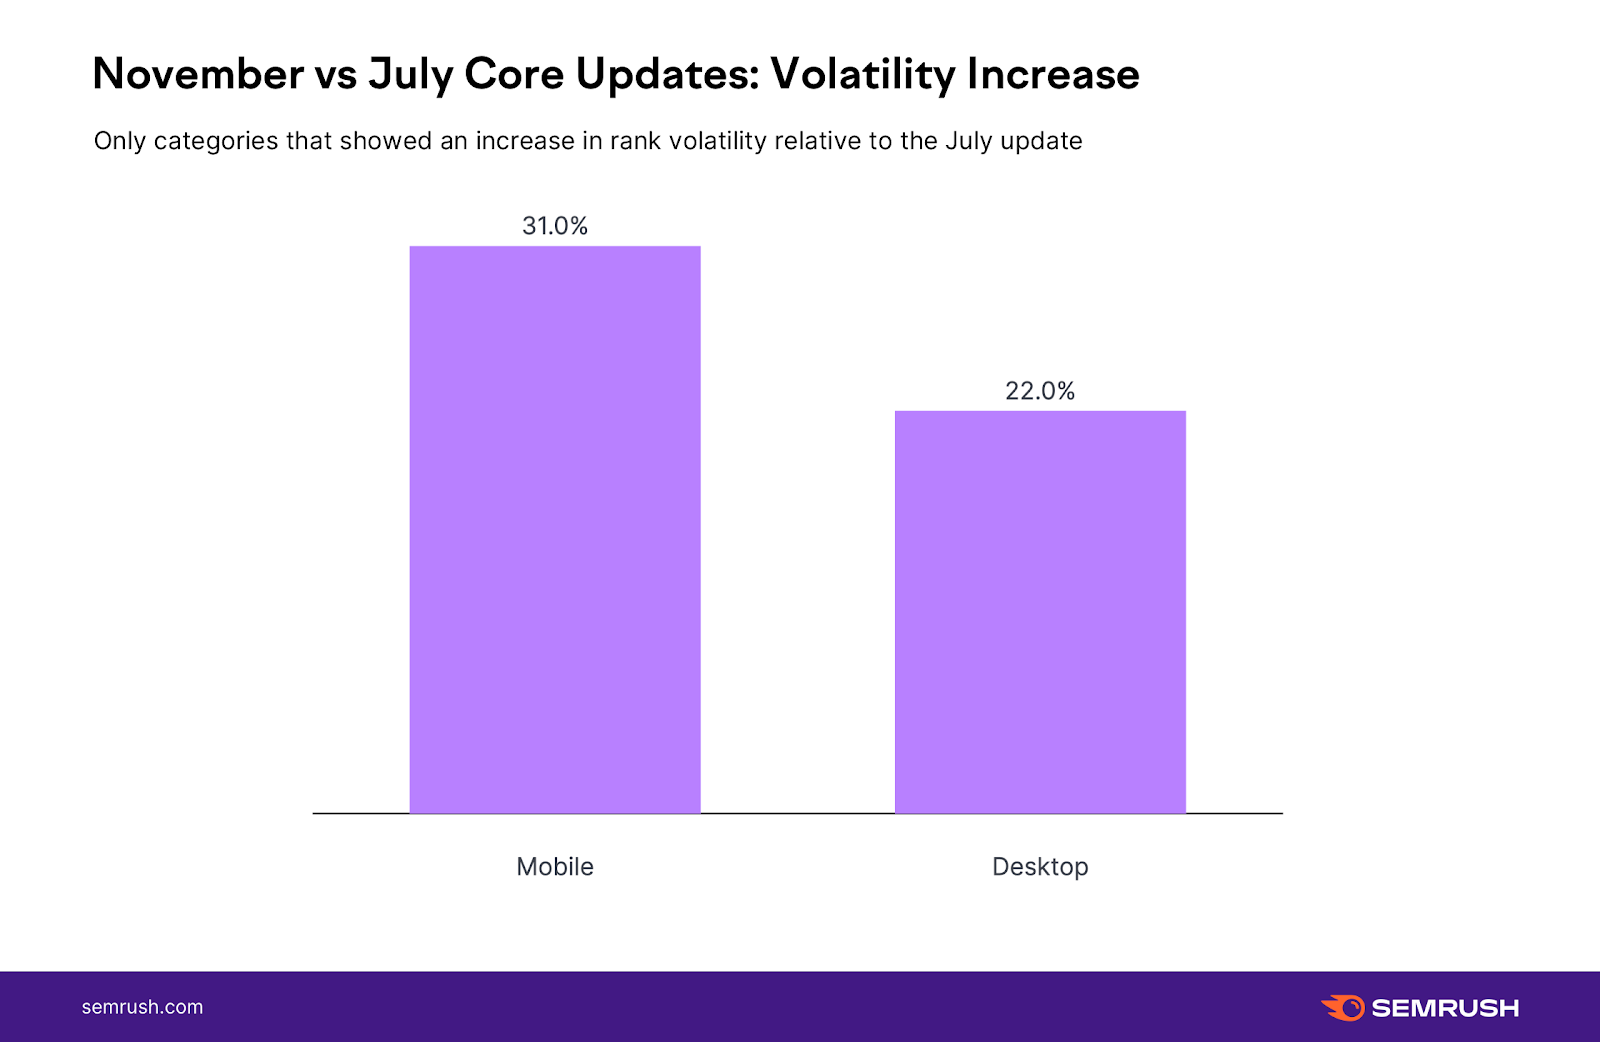
This means that those niches that saw increased rank volatility relative to the July update were way more volatile than the overall averages (i.e., 12% desktop and 23% mobile).
Of the industries analyzed, 5 showed a 30% or greater increase in volatility relative to July:
- Pets & Animals
- Health
- Real Estate
- Autos & Vehicles
- Travel
On mobile, we saw even more industries like that — here are the 9 verticals that showed a 30% or greater increase in volatility relative to July:
- Health
- Pets & Animals
- Science
- People & Society
- Real Estate
This once again highlights the notable difference between mobile-desktop volatility during the update.
Qualifying the Impact of the November 2021 Update
The November 2021 core update wasn't simply more volatile than the previous one. The extent of this volatility was also greater (depending on how you looked at the rank movement).
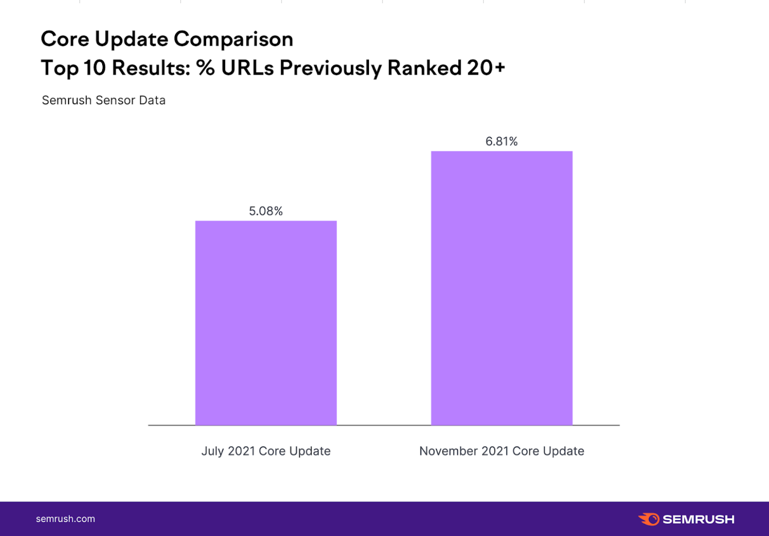
During the July 2021 core update, out of the top 10 SERP results, only 5% ranked beyond position 20 prior to the update. Yet with the November 2021 update, almost 7% of pages that made it to the top 10 results weren’t within the top 20 positions before the update.
This implies the shifts themselves were more drastic during the November 2021 Core Update than during the previous update (July 2021).
However, we see a different picture when we look at the top 5 results:
- During the July 2021 Core Update 7.4% of URLs ranking in the top 5 previously ranked beyond position 20;
- During the November 2021 Core Update only 4.4% of URLs ranking in the top 5 previously ranked beyond position 20.
This means that for the positions that matter the most, this time, Google did not take as many URLs that previously ranked 20+ (as compared to the July update). That is, Google was far more willing to drastically alter rank for positions 5-10 than it was for positions 1-5 during the November update.
As again, when looking at positions 1-10 overall, we already saw that in November Google had a greater propensity to look beyond position 20 for a "good" URL to rank (whereas with positions 1-5, this was not the case, at least not the same extent).
How Many URLs Saw Impactful Position Shifts During November 2021 vs. July 2021 Core Updates?
To widen the scope of our November 2021 core update analysis, we looked at the pre- and post-update top 20 results. The post-update top 20 featured 16% new URLs. These are pages that ranked below position 20 before the update rolled out.
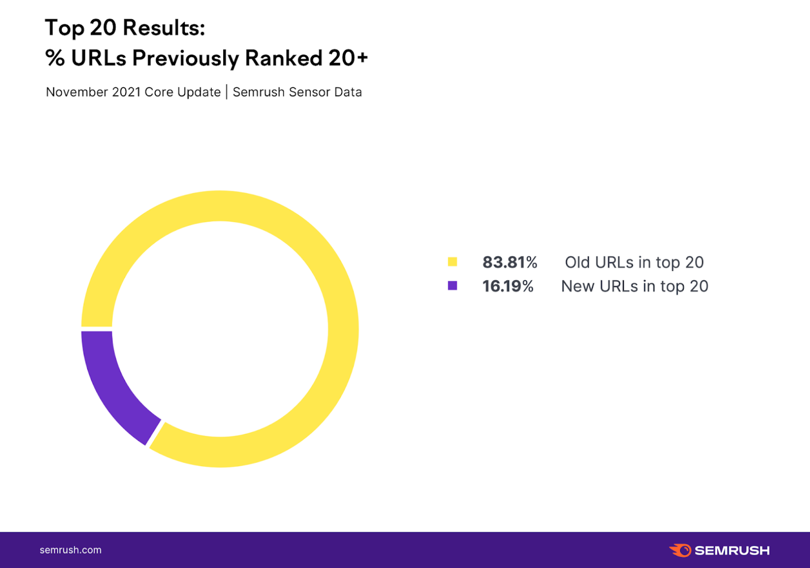
Yet this level of positive change does not necessarily apply to the most coveted positions on the SERP (positions 1-5) as explained above.
It would be interesting to see how this develops and whether Google will “experiment” with the new URLs in positions 5-10 that came from beyond page 2 to see if they are worthy of being put in the top 5. In other words, Google may (or may not have) moved URLs ranking 20+ previously into positions 5-10 in order to evaluate them for further fluctuation.
Do We See Parity Between Rank Loss and Gain?
With an update, there’s often too much focus on the negative possibilities, mainly ranking losses. This can make good sense as the fear of loss of rank is very real and very impactful.
However, it’s important to remember that Google also rewards sites, and an update can mean better organic performance for your site.
This time around, gains vs. losses were pretty balanced, with the average number of positions lost being at 3.34 and the average gain at 3.19.
That does not imply, though, that there was parity across the board.
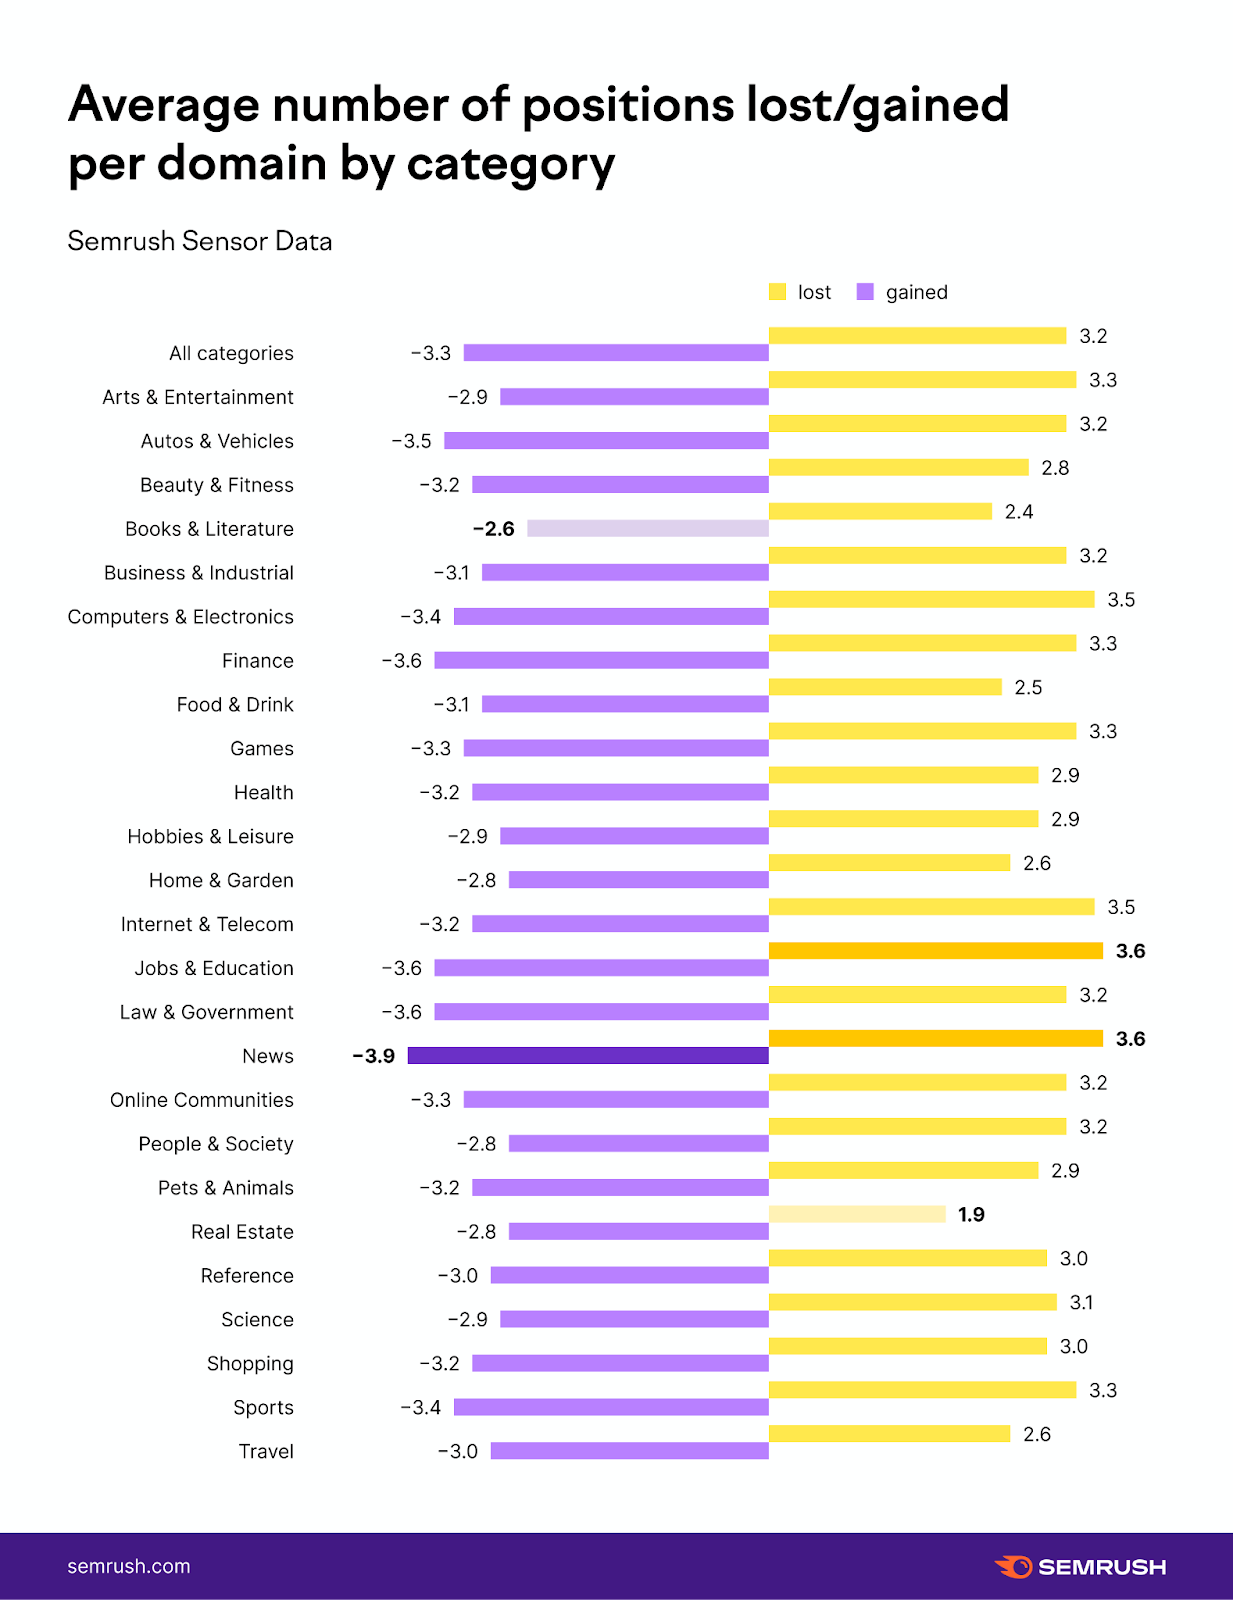
For example, the parity in niches like Food & Drink or Real Estate was less evident than in industries like Art & Entertainment or Hobbies & Leisure.
The notion of parity makes sense. After all, something has to replace the sites that underwent ranking losses. Thus, for those niches that saw a greater average loss than gain, it means that the sites already ranking well most likely saw smaller gains in order to fill the gaps left by those URLs that underwent more drastic losses.
So they were just filled with more “micro” movement than drastic movement.
However, if you look at the parity overall, it does point to Google both equally demoting and uplifting sites within a given vertical.
From a helicopter view, though, the average losses and gains do not seem “earth-shattering.” So while the data earlier points to Google moving more URLs from position 20+ into the top 10 — that is not the normal type of movement shown throughout the update (as the average gain/loss hovers around 3 positions).
There are a lot of sites that were significantly impacted during the update — far more than the number impacted day in and day out — but still, the typical movement most sites will see (if they see any movement at all) is likely to be within the range of three positions. At least, with the November 2021 core update.
Average Gains and Losses From the November 2021 Core Update
If we look at the top 100 websites that saw the biggest losses and gains, we’ll see the following picture:
- The November 2021 core update winners gained around 33 positions, with an average position of 10.
- The losses look slightly more moderate. On average, those hit the hardest by the update lost around 28 positions. Just as during the July 2021 update, the average page that was within the top 100 most negatively affected list ranked at position 16.
| Top 100 winners | Top 100 losers | ||||
| Gained Positions | Average Position | Lost Positions | Average Position | ||
| 33.6 | 10.41 | -27.59 | 16.28 | ||
Over to You
With an update that looks more volatile than the last ones to date, you can only follow Google’s good old advice that doesn’t change much from update to update.
But as we see a heavier influence on mobile rankings — which might be the “new normal” when it comes to broad core algo updates — make sure to pay attention to your site’s mobile experience and performance.
This post reveals everything you need to know to prepare your site for Google core algo updates.
Other than that, as with every core update, we see a great emphasis on quality content, so the best way to navigate the storm caused by every other core algo update is to keep creating great content and perfecting your existing pages. This essential guide to content creation will reveal how.
