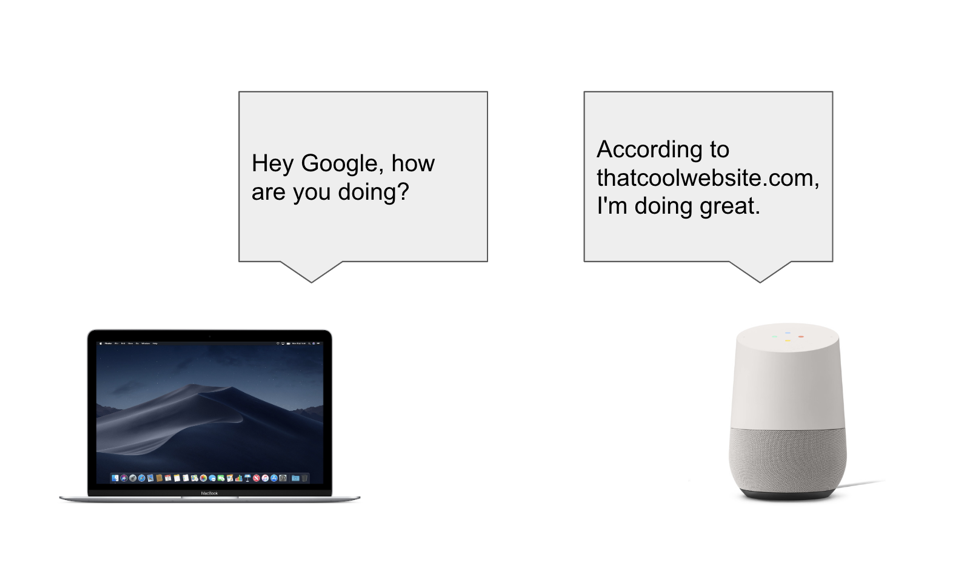
To understand which parameters marketers need to consider when working to rank a page for voice search, we conducted an in-depth study, analyzing the results of over 50,000 queries split across three devices.
Our study, which you can view here, produced a series of findings, including 10 key factors that influence how a voice search answer is selected by Google Assistant.
Below you will find our complete methodology, which describes the data gathering process in full.
1. The Hardware
We used three different devices to understand whether the device being used to ask Google Assistant a question had any impact on the answers returned.
We took two home speaker devices and an Android smartphone and programmatically asked them all tens of thousands of questions, recording the answers from each one.
The devices we used were:
-
Google Home
-
Google Home Mini
-
Xiaomi Redmi 6 (Android)
In the case of the Xiaomi Redmi 6, all answers were recorded using headphones to ensure Google Assistant would read the answer out loud. It is unclear whether using headphones had any influence on the answers given as we did not study this effect (due to it not being a major point within our study).
Additionally, all devices were set to the same location to provide geographic consistency. The location we chose was New York City and more specifically, the Empire State Building.
2. Producing a List of Questions
We curated a list of questions to ask Google Assistant. The questions were produced both manually and through SEMrush’s API; this was done using three separate methods, and they were:
Common Questions
A list of common questions was gathered from the SEMrush database and previously published analyses.
Example queries included:
-
What to wear to a wedding?
-
What is a cover letter?
-
How to pass a drug test?
Keyword Generated Questions
We also used a series of seed words to generate queries. These were based upon a random selection of keywords. Taking these seed words, we gathered common questions that featured the keywords themselves.
Using the keyword “t-shirt” as an example, questions asked included:
-
How to fold a t-shirt?
-
How to make your own t-shirt?
-
How to print t-shirts?
Using Lists To Build Common Questions
We took a list of popular subjects (including animals and countries) and looped them through a set of base questions with the subject injected into each one.
In the case of animals, for example, it worked in the following way:
List of Animals:
-
Turtle
-
Dog
-
Cat
List of Questions:
-
How long does a <Animal> live?
-
Can I have a <Animal> for a pet?
Looping the Animal Through the Question List
-
How long does a turtle live?
-
How long does a dog live?
-
How long does a cat live?
-
Can I have a turtle for a pet?
-
Can I have a dog for a pet?
-
Can I have a cat for a pet?
This approach allowed us to recognize trends and eliminate results that weren’t pertinent to the study. For example, our research suggests that Google may have go-to sources for certain types of questions, as queries based upon celebrities and their lives regularly return results from biography.com. This insight shows that some answers returned as voice search appear to come from a select number of trusted sources, irrespective of whether other results in the SERP have more impressive metrics.
3. Asking Questions
When it came to asking questions, we used the same iterative process throughout. The process ran as follows:
-
A question was fed into Google Text-to-Speak, which then converted it into an audio file.
-
The audio file was then played using a computer’s speakers, for example, “Hey Google, can I have a turtle for a pet?”
-
Google Assistant was given five seconds to process the information and speak the answer.
-
We then played a pre-recorded audio file stating, “Hey Google, stop.” This was due to Google Home devices having problems interpreting some questions sent while the device was speaking.
-
Three seconds were given as a buffer, after which the question was sent to a file containing all questions for cross reference in order to avoid repetition.
-
The process then reverted back to step one.

4. Analyzing The Questions & Answers
By logging into myactivity.google.com, we were able to extract all the voice searched questions and answers from the aforementioned activity. We exported this data as an HTML file and crawled it via the Python Library Beautiful Soup.
The file exported contained blocks of information, including:
-
The question asked.
-
The answer provided by Google.
-
A link to the source of the answer, if applicable*.
*In some cases, particular questions asked via the Android device didn’t provide a link with the answer. For example, when we asked “How old is Lady Gaga?”, the answer provided was “32 years” (with a link not necessary.)
Other factors where a link wasn’t provided included:
-
The answer was a list of photos (Android only).
-
Google didn’t know the answer - the response was “I cannot help with that yet.”
Once the file was exported, we collected the answers and placed them into a table for further analysis.
| Question | Answer | Link | Device |
| What is the best SEO tool? | It's SEMrush. | www.semrush.com | Google Home Mini |
5. Collecting the SERPs
Once the data had been collected, it was placed into a formatted table, with the questions and answers alongside their positions and any SERP features occupied.
To keep the study consistent, we used the exact same location for all three devices with the exact same questions.
The results were then returned in the format as seen below:
| Question | URL | Feature Type | Position |
| What is the best SEO tool? | www.semrush.com | featured_snippet | -1 |
| What is the best SEO tool? | www.semrush.com/seo | organic | 1 |
By using this method, we were able to collect the ranking position of each answer along with any SERP features for which an answer ranks (e.g., Featured Snippet). It is worth noting that SERP features that didn’t contain a URL, such as the Knowledge Panel, were not collected.
6. Collecting Metrics
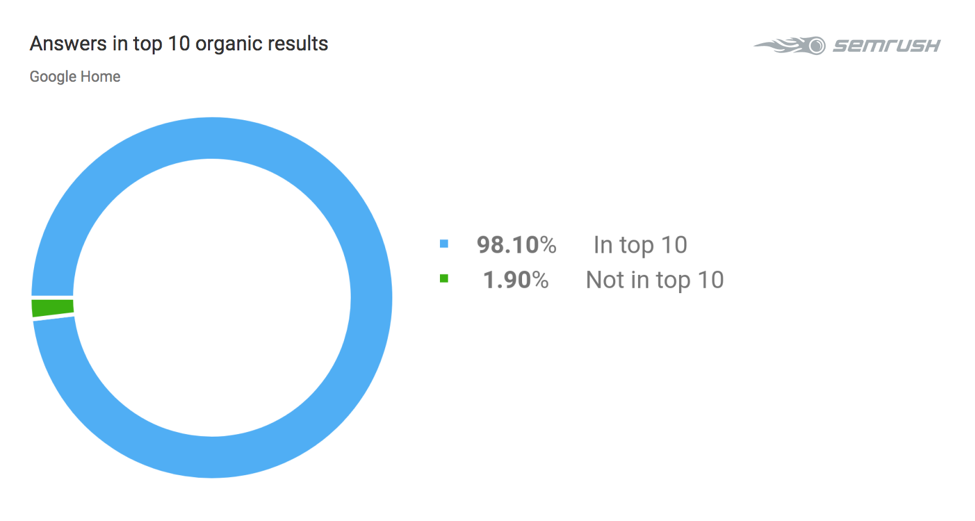
When collecting metrics, we selected the top 10 organic results and SERP features for analysis. It was possible to analyze the top 100 results. However, the preliminary analysis found that 97% of answers selected by Google Assistant came from the first page; this made analyzing 100 results from each question unnecessary.


From each URL in the top 10 of the SERP, we collected the following data:
-
Schema: This was obtained directly from the page itself, through “requests” and “BeautifulSoup”.
-
Page Performance: Page speed and other indicators were collected using the Google Page Speed API.
-
Backlinks: We used the SEMrush Backlink Analytics API to provide information on backlinks to the top 10 within the SERP.
We also analyzed several other indicators from the text itself to establish ranking factors within voice search. These included:
-
Complexity: The type of language used within the answer.
-
Text Length: A simple word count of the answers was taken.
We used many different scales to analyze the complexity of the text. These were:
-
Flesch Kincaid Grade & Reading Ease
-
Dale Chall Readability Score
-
Coleman Liau Index
-
Linsear Write Formula
-
Automated Readability Index
Page Performance Metrics
Below you will find further information on the metrics we obtained when analyzing page speed performance. The metrics we evaluated can be found in the list below:
-
DOM nodes
-
Max Child Elements
-
Max DOM depth
-
Estimated Input Latency
-
First CPU Idle
-
First Contentful Paint
-
First Meaningful Paint
-
Interactive
-
First Paint
-
Last Visual Change
-
Observed Load
-
Speed Index
-
Time To Interactive
-
Total Byte Weight
-
Time To First Byte
Backlink Metrics
We studied a number of metrics related to backlinks using the SEMrush API. Below you will find a full list of those gathered:
Backlinks Report:
-
Anchor_kw
-
External_num
-
Form
-
Frame
-
Image
-
Internal_num
-
Lostlink
-
Newlink
-
Nofollow
-
Page_score_mean
-
Sitewide
-
Source_size
-
Source_title_kw
-
Trust_score_mean
Backlinks Overview Report:
-
Domains_num
-
Follows_num
-
Forms_num
-
Frames_num
-
Images_num
-
Ipclassc_num
-
Ips_num
-
Nofollows_num
-
Score
-
Texts_num
-
Total
-
Trust_score
-
URLs_num
Backlinks Refdomains Report:
-
Backlinks_num
-
Country
-
Domain_ascore
-
Domain_score
-
Domain_trust_score
The description for each metric can be found here.
In the API parameters in “backlinks_refdomains” and “backlinks”, reports are set as:
-
"display_limit=100"
-
"display_sort=backlinks_num_desc"
The single values for these reports are the mean average of the top 100 results.
Read Our Voice Search Study
Our in-depth study used the methodology above with two main objectives focussed on:
-
Understanding the parameters that Google Assistant uses to select answers to voice search queries.
-
Comparing and understand differences in answers obtained from different devices.
How does this apply to voice search marketing? From this, we uncovered 10 key ranking factors across several areas, ranging from word counts to pagespeed, that have a clear influence on voice search results – all invaluable insights to consider when using voice search optimization services.
You can view our study and unveil the key ranking factors influencing voice search results by clicking here.
