User behaviors are tough to predict at the best of times in SEO, but what if more and more searchers just…aren’t clicking? And what if the likes of Google are benefiting from changing behaviors more than content creators themselves?
The phenomenon of zero clicks in Search is leaving many marketers wondering how their target customers are acting, and grappling with how best to appeal to them online.
The topic has had plenty of coverage and attention, but often without a great deal of context, so that’s why we’ve carried out a new zero-clicks study with a more refined sample size from our own data sources.
Let’s dive right into the State of Search and the rise of zero clicks, shall we?
Our Methodology
The data set is based entirely on the clickstream data Semrush receives from third-party providers. We took an anonymous sample of 20,000 unique users (user IDs) evenly spread across desktop and mobile. Our goal was to avoid generic views based on a large-scale study, and create new and valuable insights from a more focused sample instead.
Time range: May 2022
Region: US
Platform: Desktop and mobile
For these users, we extracted search requests made on Google and the next two steps (clicks) made after these searches. We assumed that the first action was always a general search and not one for Images, News or anything else—just a classic Google search—and we filtered out the actions that had more than two minutes between them. This seemed to be a realistic amount of time to allow users to complete their search journeys.
The total number of unique search queries analyzed was 308,978 for desktop and 146,390 for mobile, which came to a total of 609,809 unique search actions.
Desktop Data
Exploratory Analysis
We didn’t use any extra filters for our keywords, and we assume our sample to be representative of general keyword distribution. Let’s take a look at some of the top-level findings from this sample:
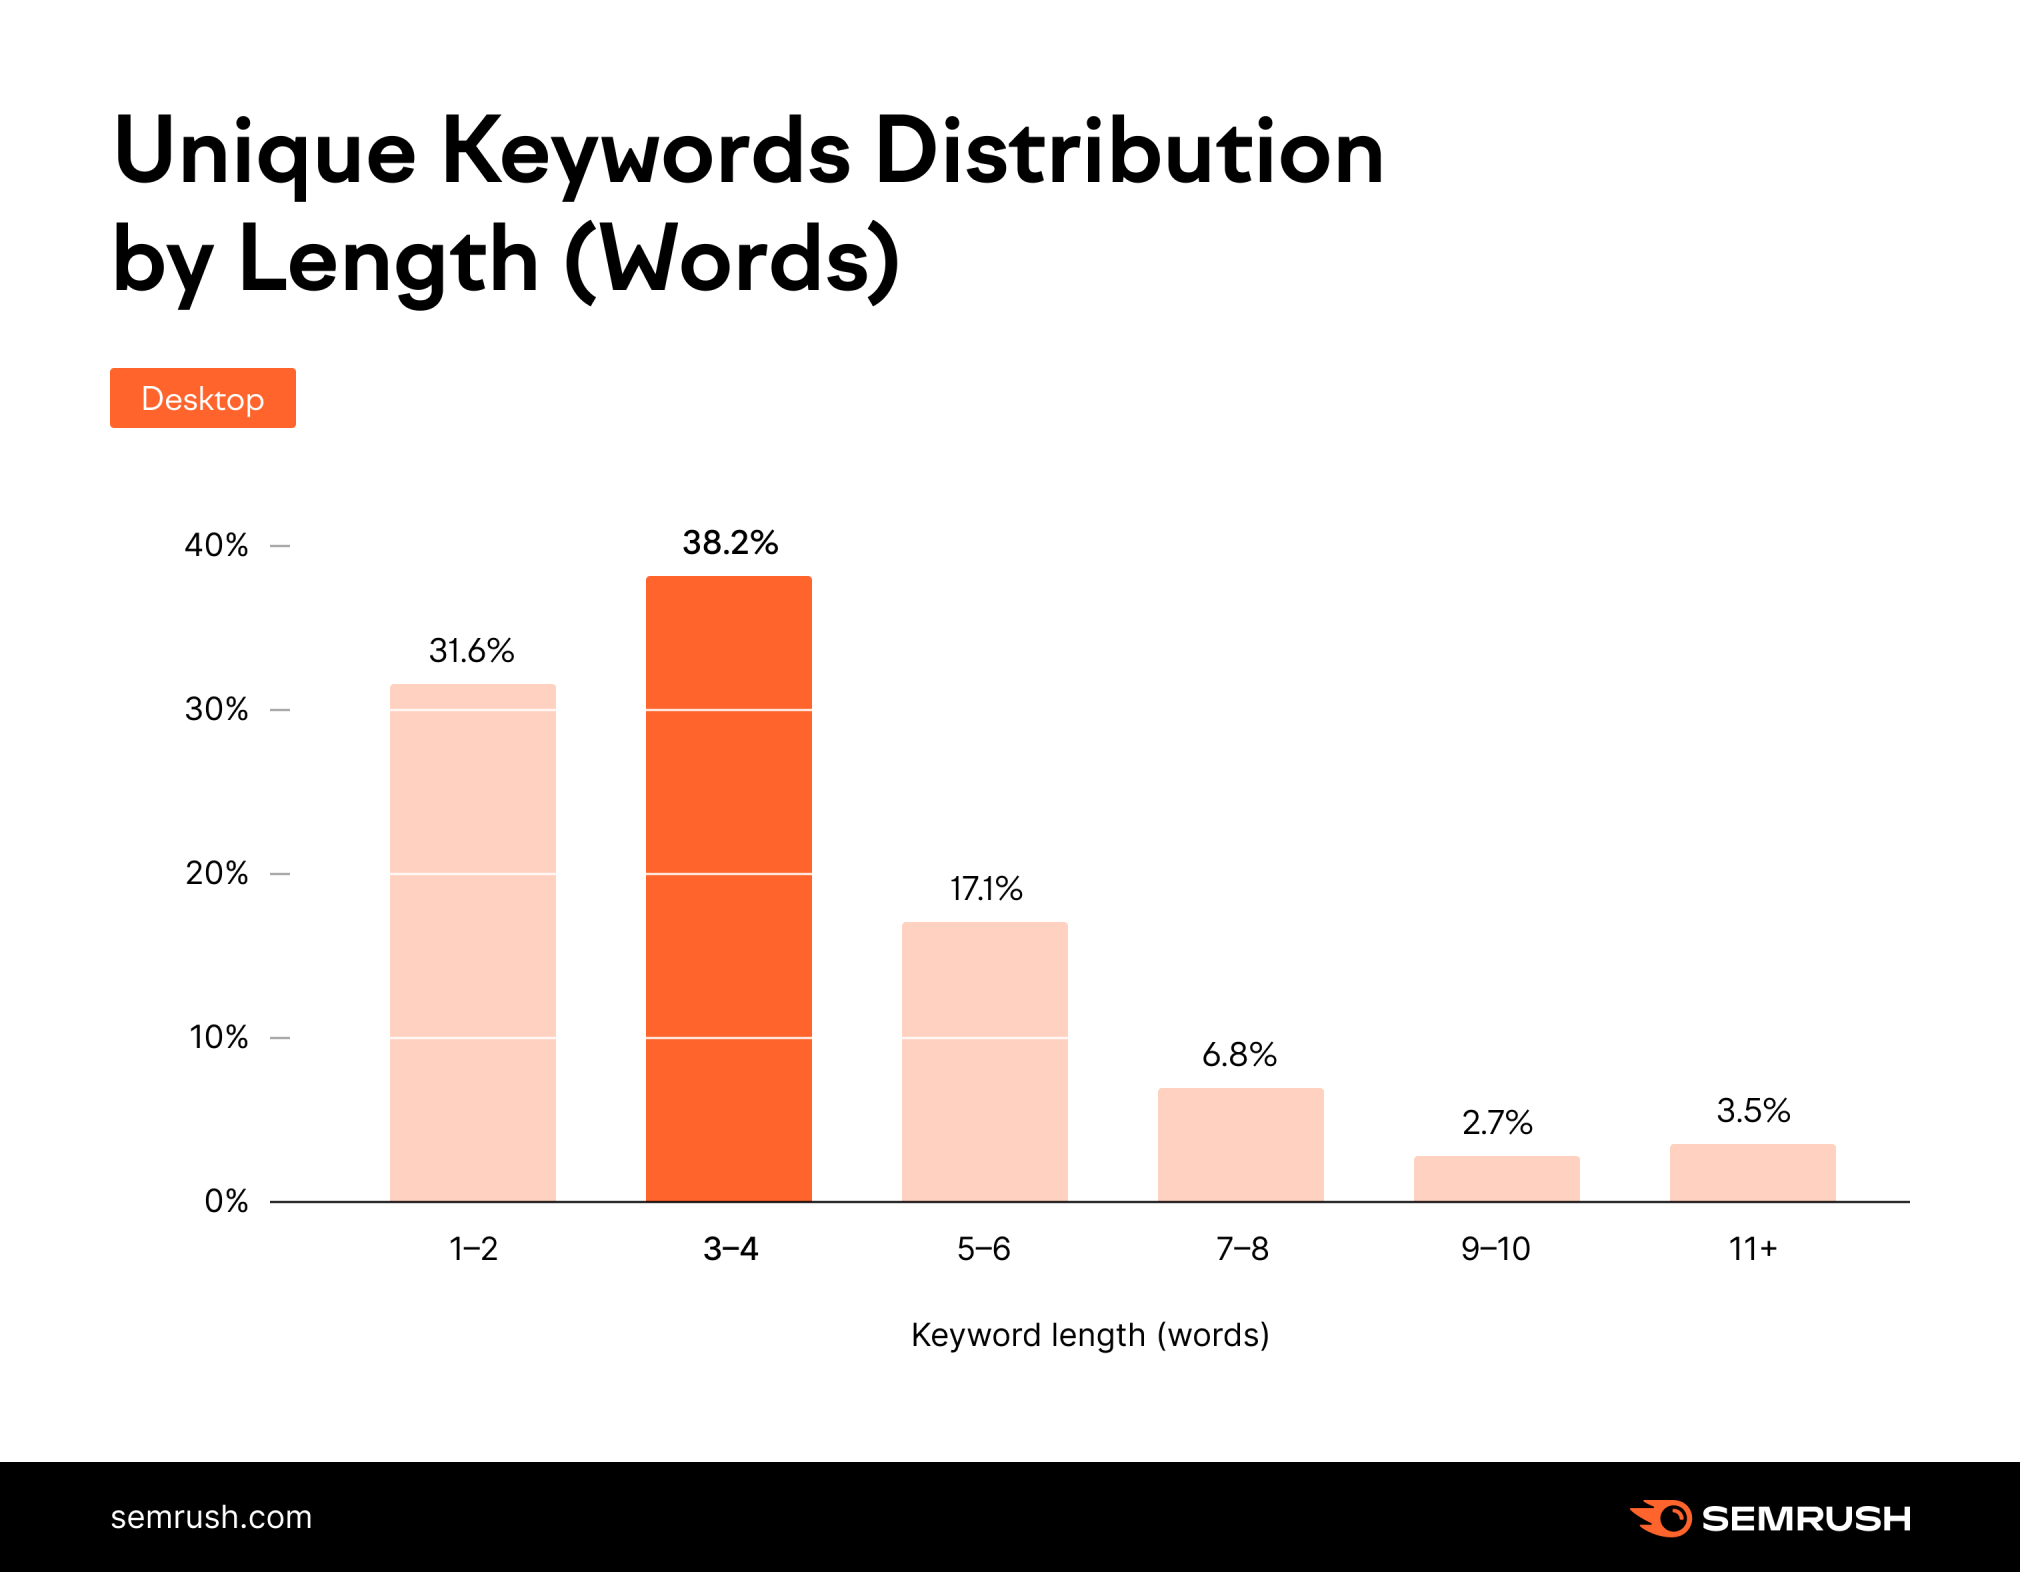
Here, we see the breakdown of the frequency of searches for keywords of certain lengths, with those in the 3-4-word bracket coming out on top. This is closely followed in second place by searches of 1-2 words in length, showing that the vast majority of searches are relatively short. This distribution seems very normal for general keyword length distribution—in fact, we saw such metrics in our State of Search report earlier this year.
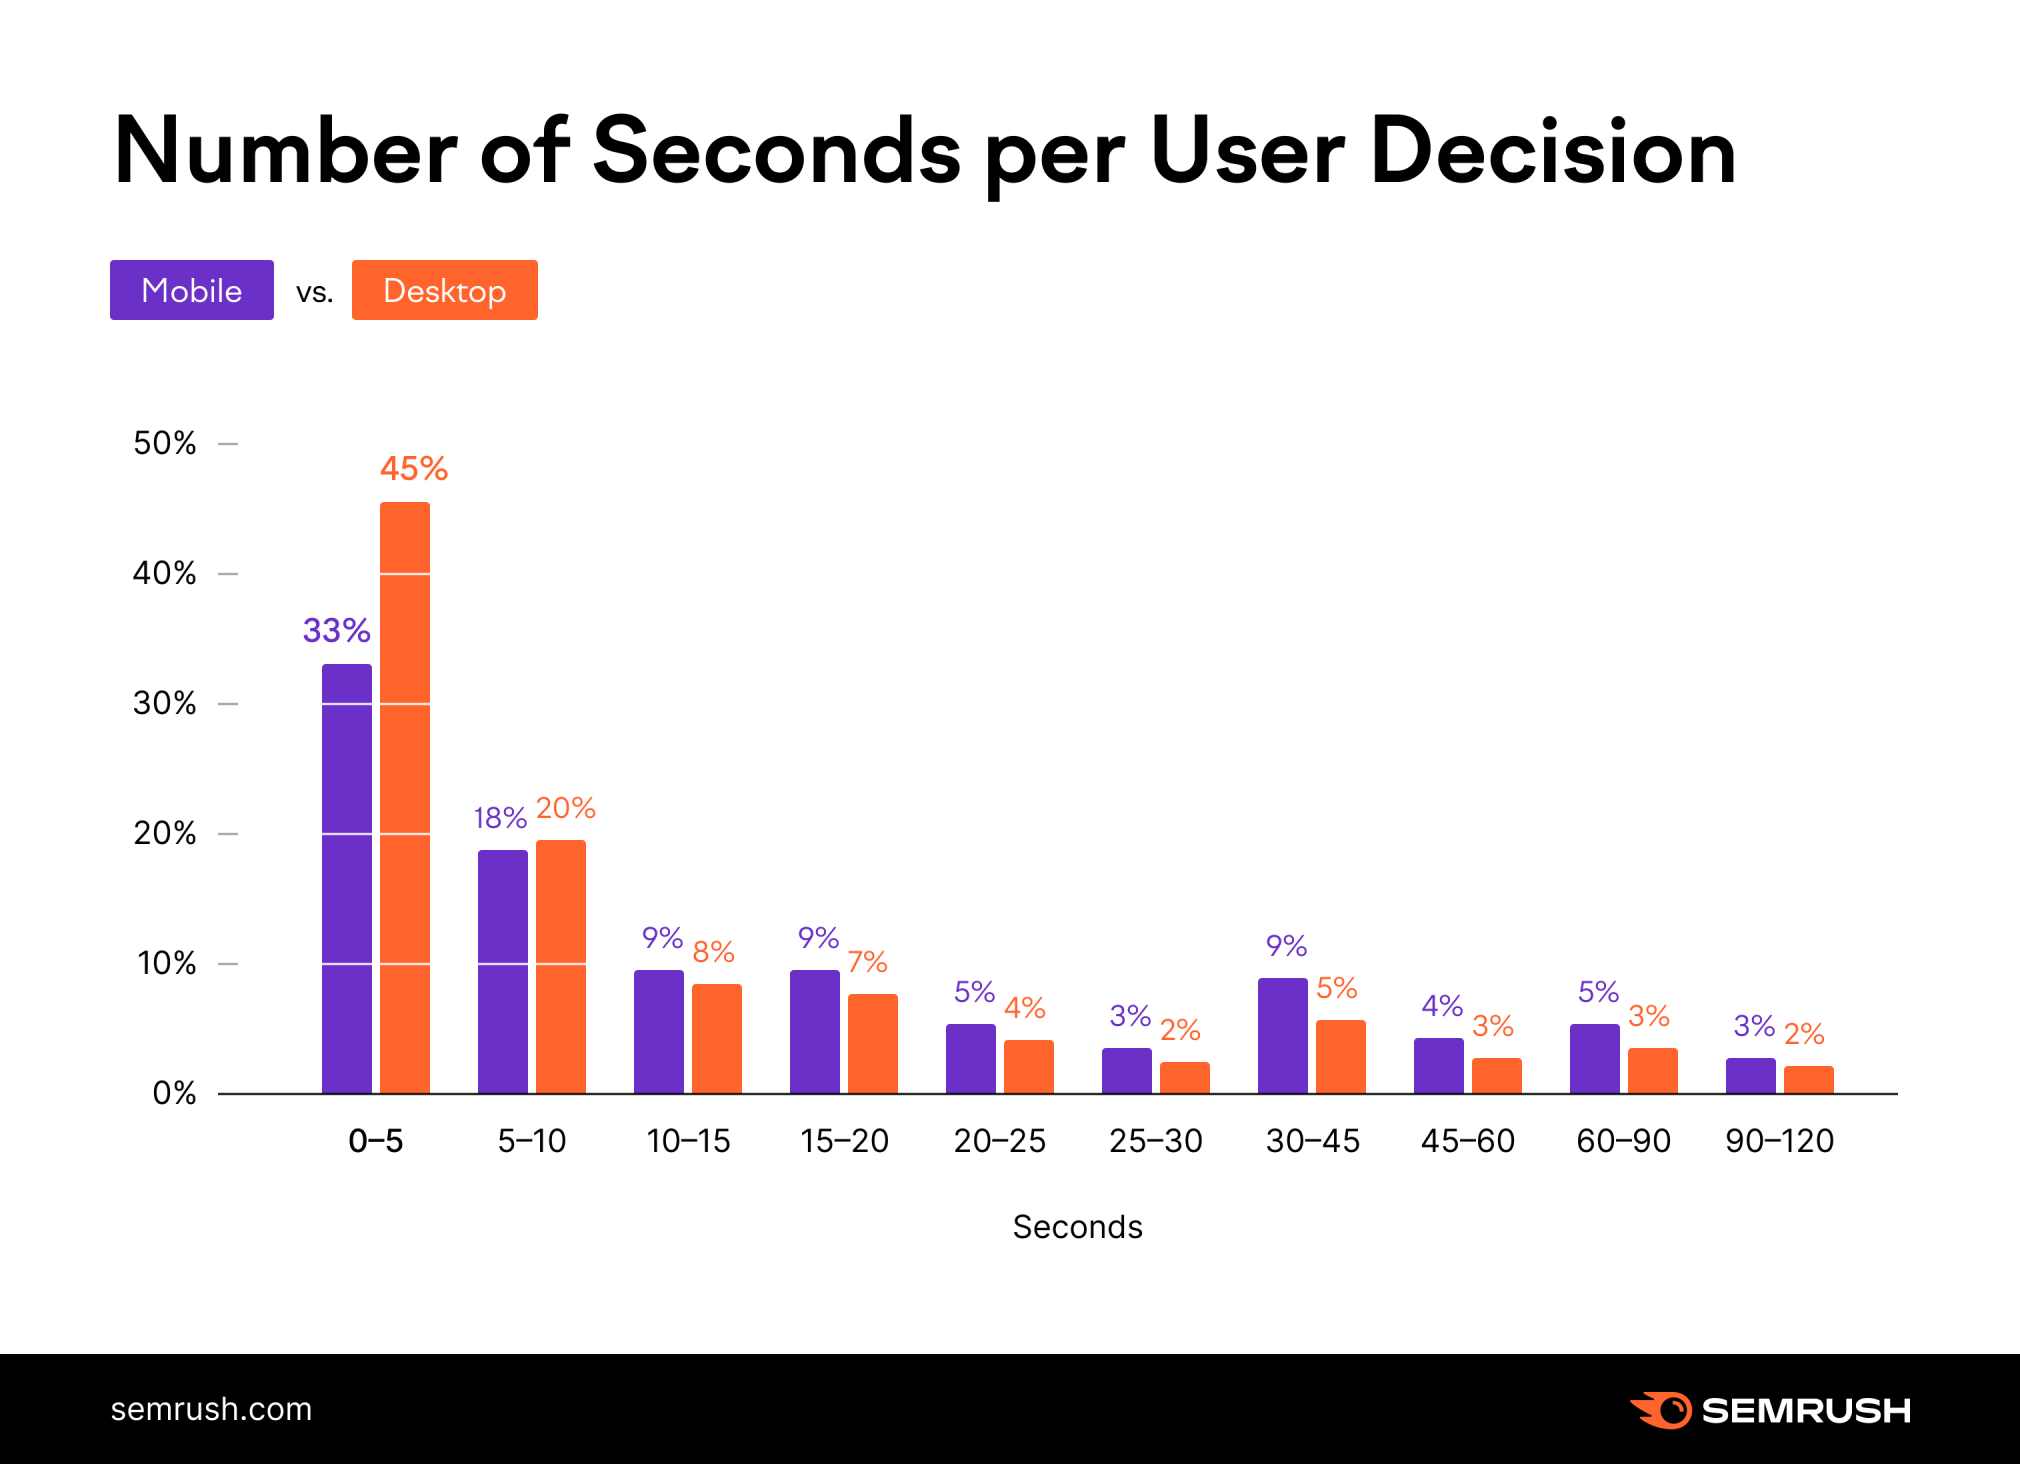
In the graph below, you can see the distribution of the time a user needs to make a decision about their next step after the first search. As mentioned in the methodology, this time is limited to two minutes to avoid suspicious data from the likes of bots, or lengthy breaks that might actually come from another session.
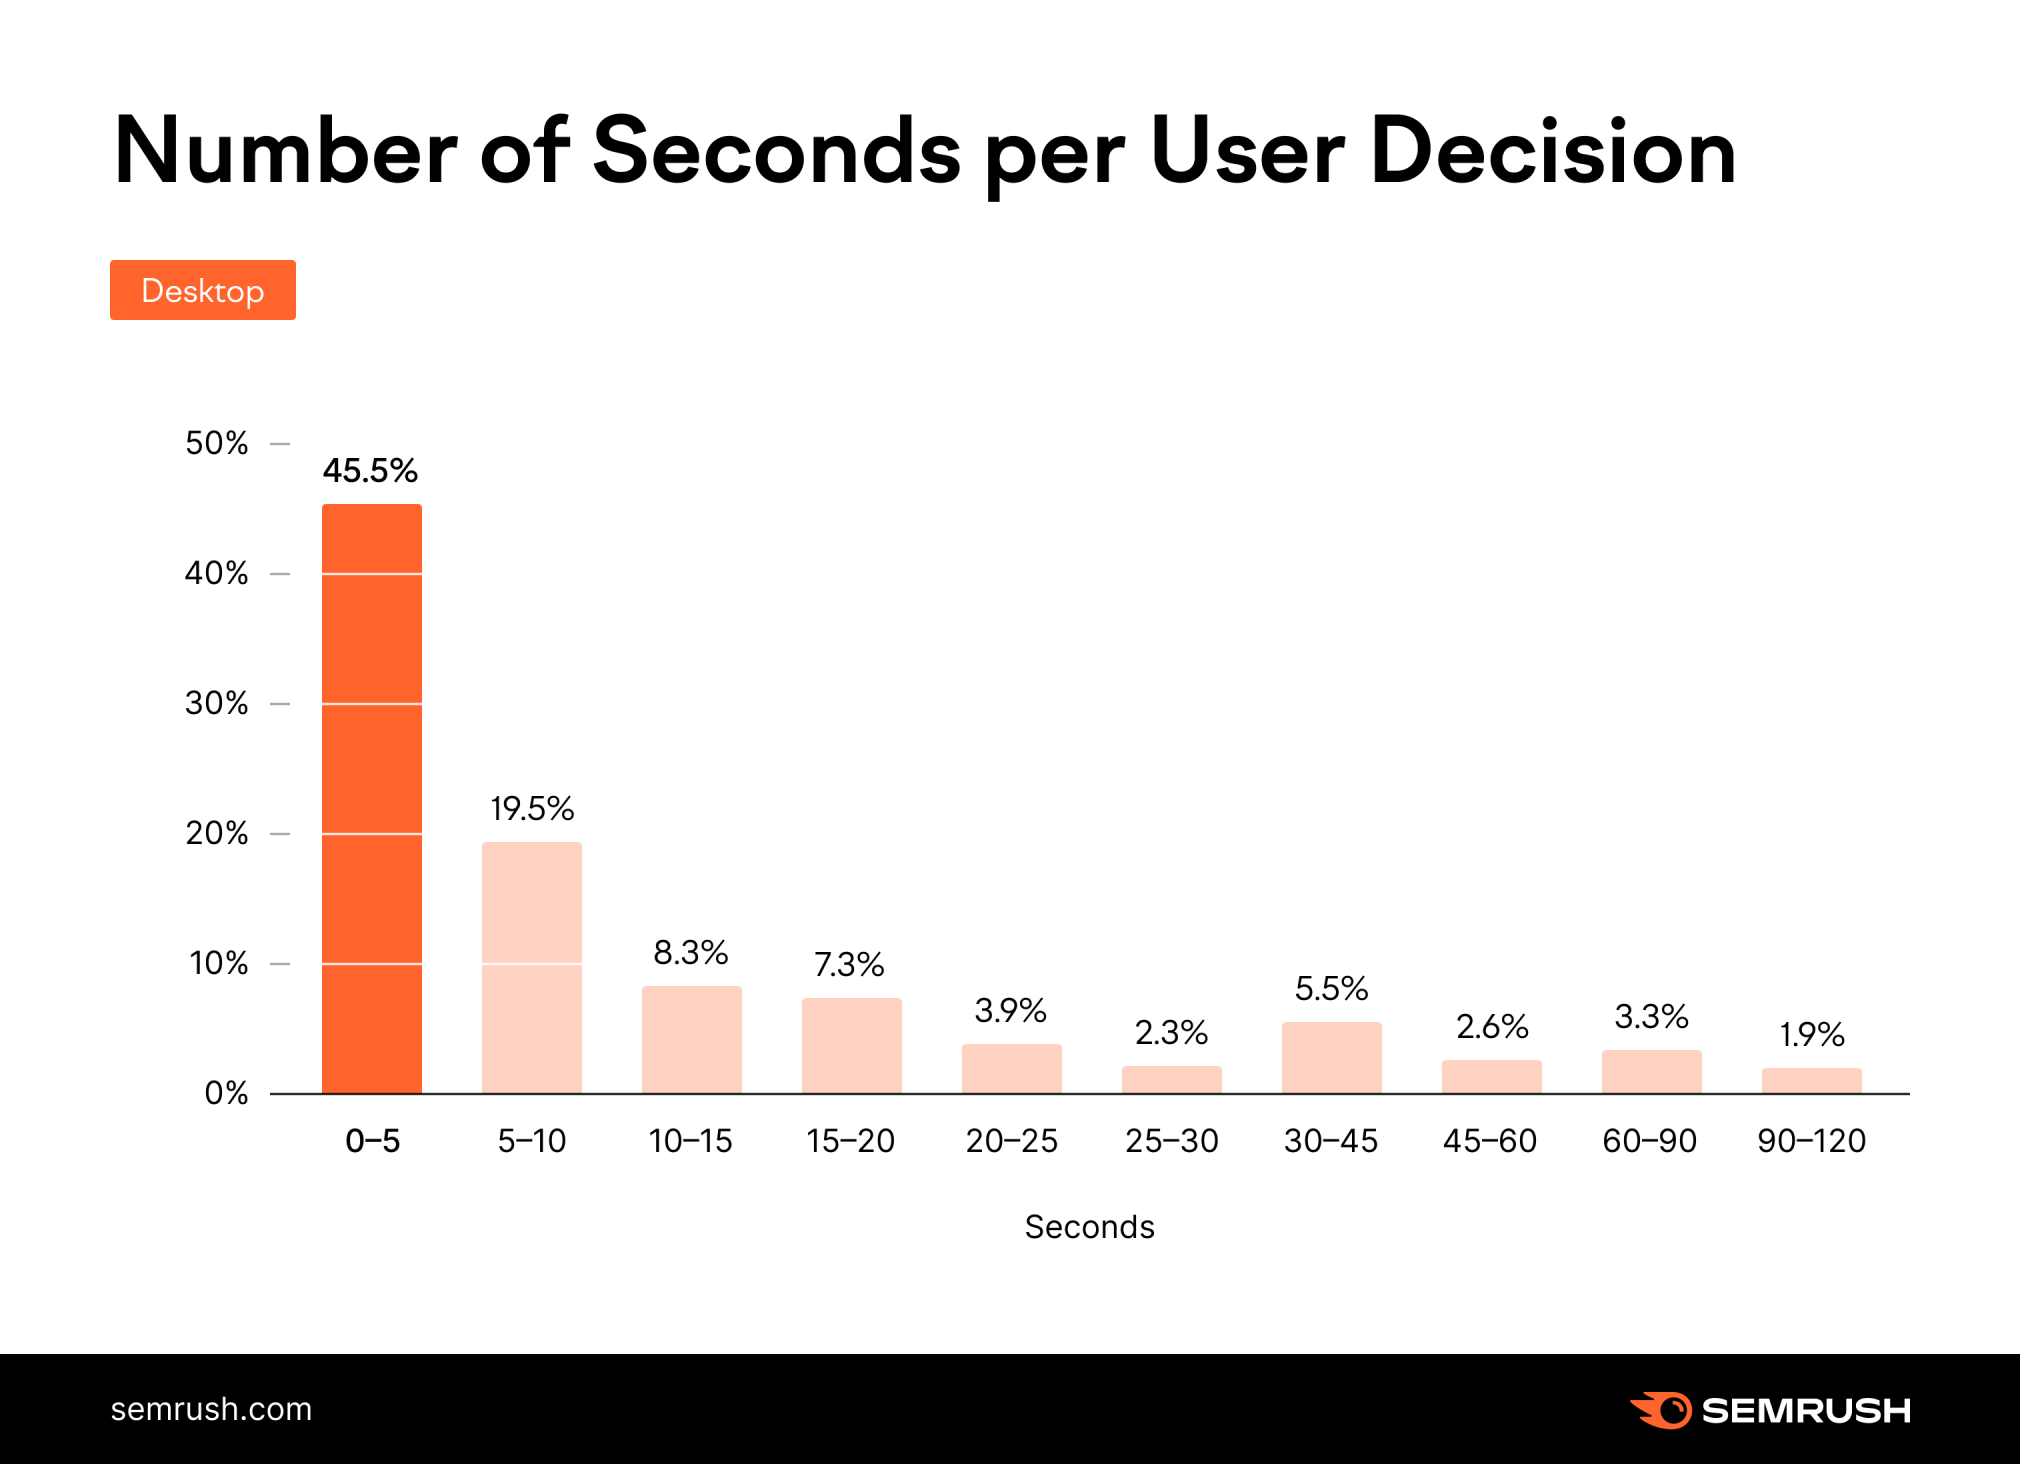
When we look at how long it takes searchers to interpret and act on their search results, we see that their decisions are mostly very quick. In the vast majority of cases, up to 15 seconds is enough time to choose what to click.
The data here emphasize the importance of how the SERP is visually constructed. People are not spending a great deal of time analyzing the results, but are making quick decisions to get to what they want.
Logically, add-ons like image thumbnails or expandable tabs, such as those that appear with an FAQ rich result, will influence how people interact with the results. That’s before we’ve considered highly visual SERP features like Image Packs, too.
What Main Patterns Emerged from the Desktop Data?
In order to make our study more detailed and insightful, we’ve expanded the groups of data beyond simply organic, paid and zero clicks. There are five main patterns of actions people undertake after completing a Google search:
- Organic clicks
The general clicks to any external website on the SERP (apart from the ads). - Paid clicks
The clicks on ads displayed in the SERP. - ‘Google’ clicks
Actions that change the URL, but keep the user in Google, such as switching from the main SERP to Images, News or Shopping, or clicking a carousel card or related searches. It’s important to note here that the keyword in the search URL doesn’t change in this scenario. - Google keyword change (= zero click)
In this case, the next action is also a Google search, but with a different keyword. It can be a situation where a user either couldn’t find the answer and decided to refine the request even more, or found an answer in something like a Featured Snippet, for instance. This can, of course, be the click to the Google keyword suggestion. This action is a zero click situation, but we have grouped it separately to check the numbers in more detail. - Other zero clicks
This includes all other cases of zero clicks inside the two-minute mark. It is essentially the remaining percentage after all the clicks from the four groups above have been subtracted.
These groups were distributed as follows in our sample:
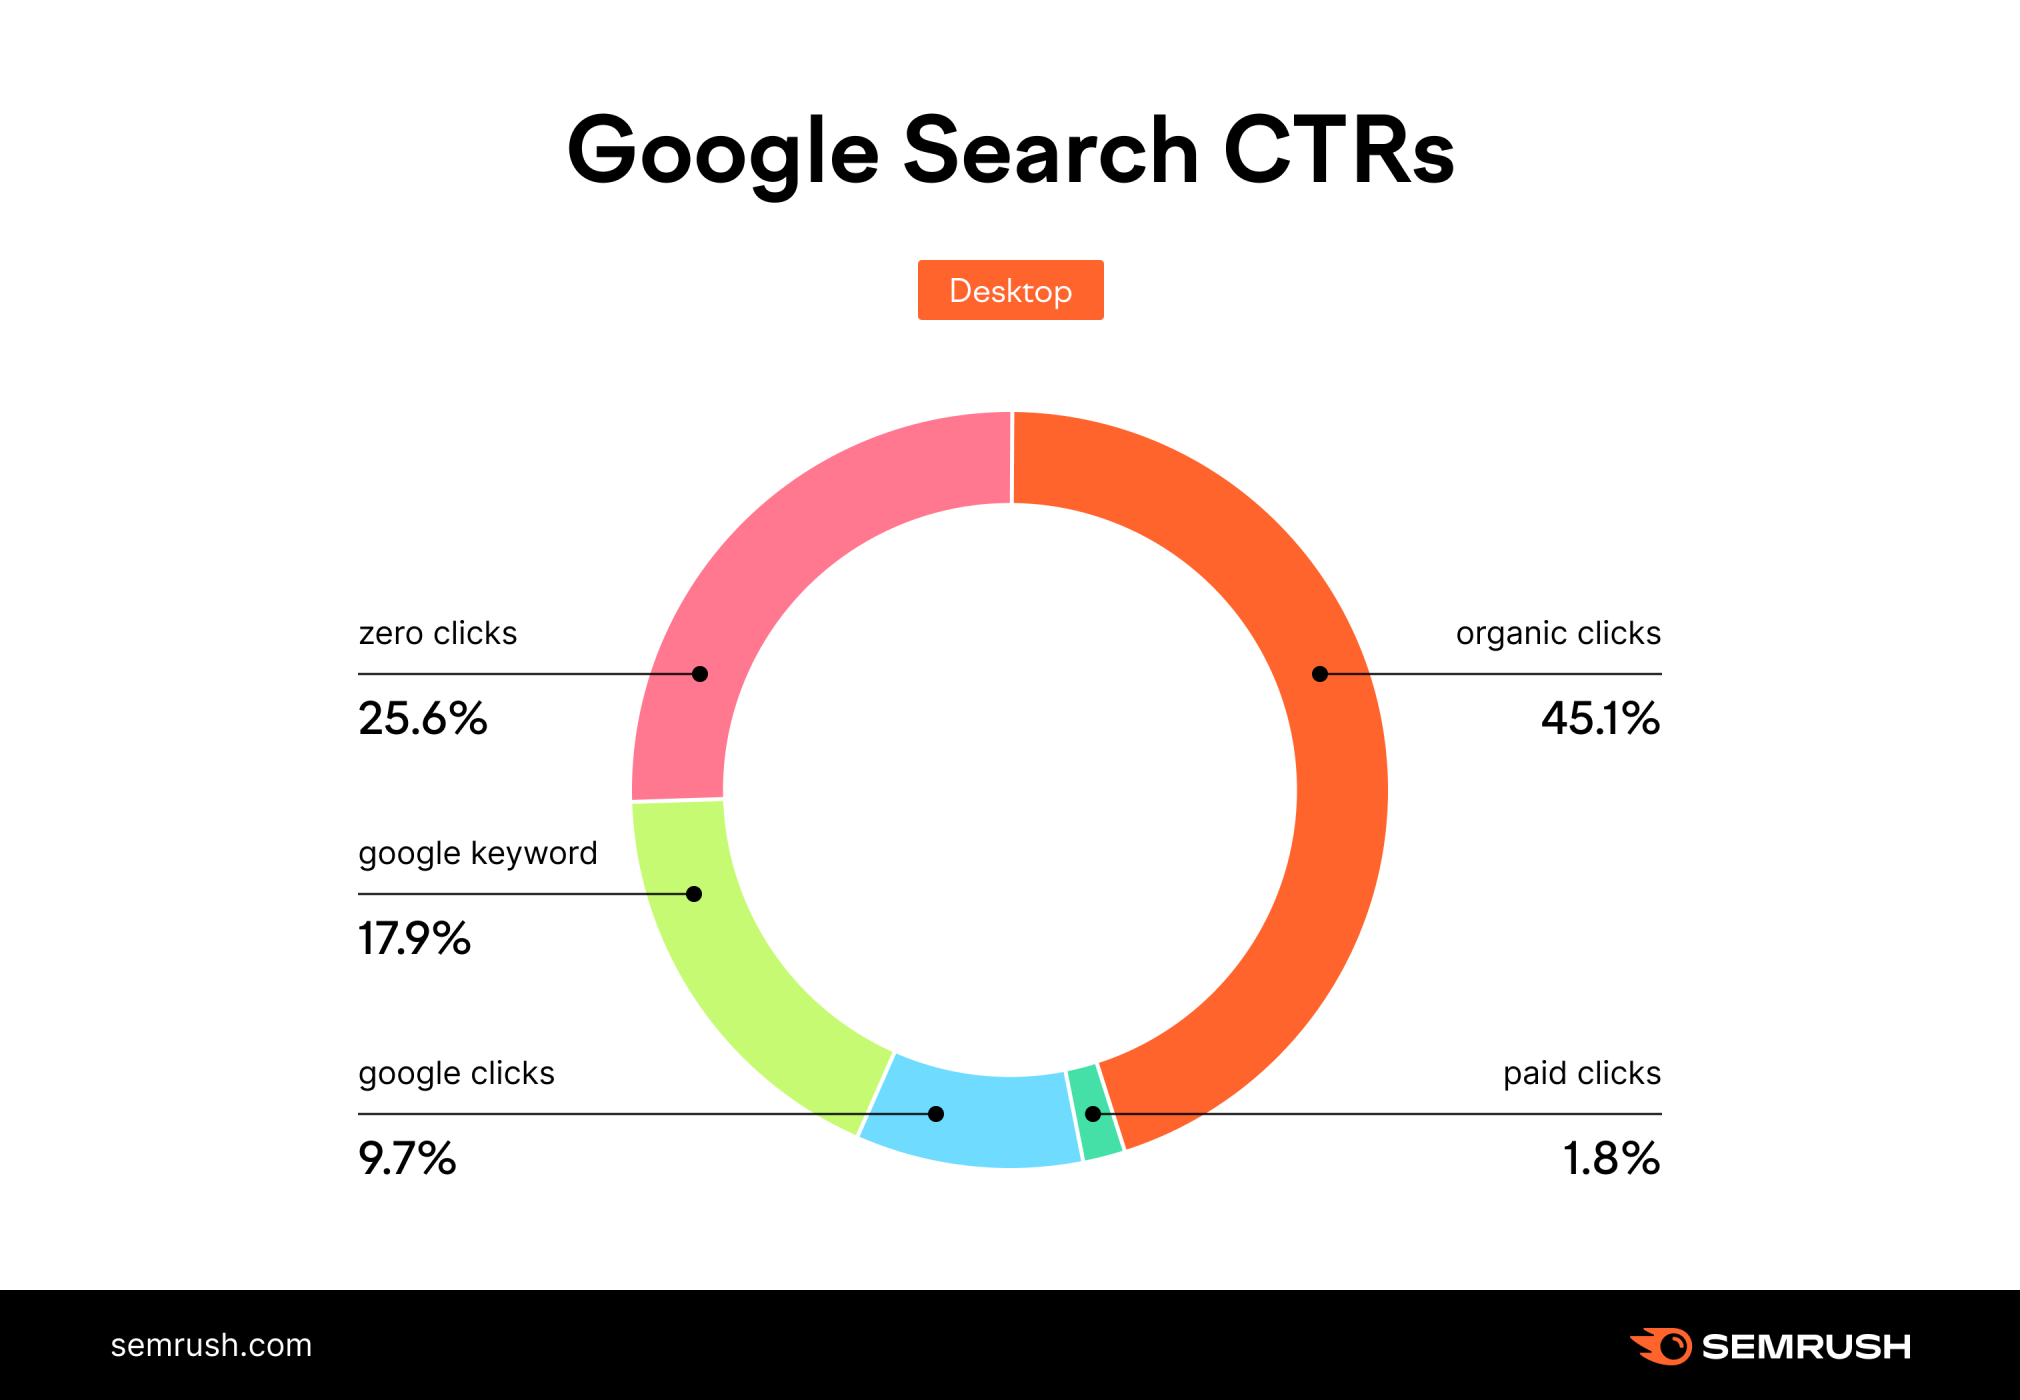
There’s a great deal of keyword refinement at play here. If we combine the number of Google clicks with the number of keyword changes, we see that almost 30% of people are either refining or extending their searches in some way. Besides that, it’s clear that organic clicks still dominate user behaviors.
The filtering of queries appears to be a seriously undervalued aspect of the user’s journey. How people search is greatly impacted by their ability to not only refine their query via the Search Bar itself, but also to use the various features in Google’s SERP.
While there has been a tremendous amount of discussion related to zero-click searches, the data indicate that query refinement should also be a core part of the overall SEO discussion. After all, 27.6% of searches eventually undergo some form of query refinement, but only 25% of searches do not result in a click.
Zero Click Patterns in Desktop Users
Now, let’s dig a bit more into what kinds of queries and SERPs result in zero clicks, starting with a look at which search types people tend to choose if they stay on Google after completing the general search.
Google search has a bunch of URL parameters or subdomains that flag the specific search type, which help us identify some of these behaviors. The signs aren’t always as easy to spot as an altered URL, though, so some are classified as ‘undefined’ in our data set.
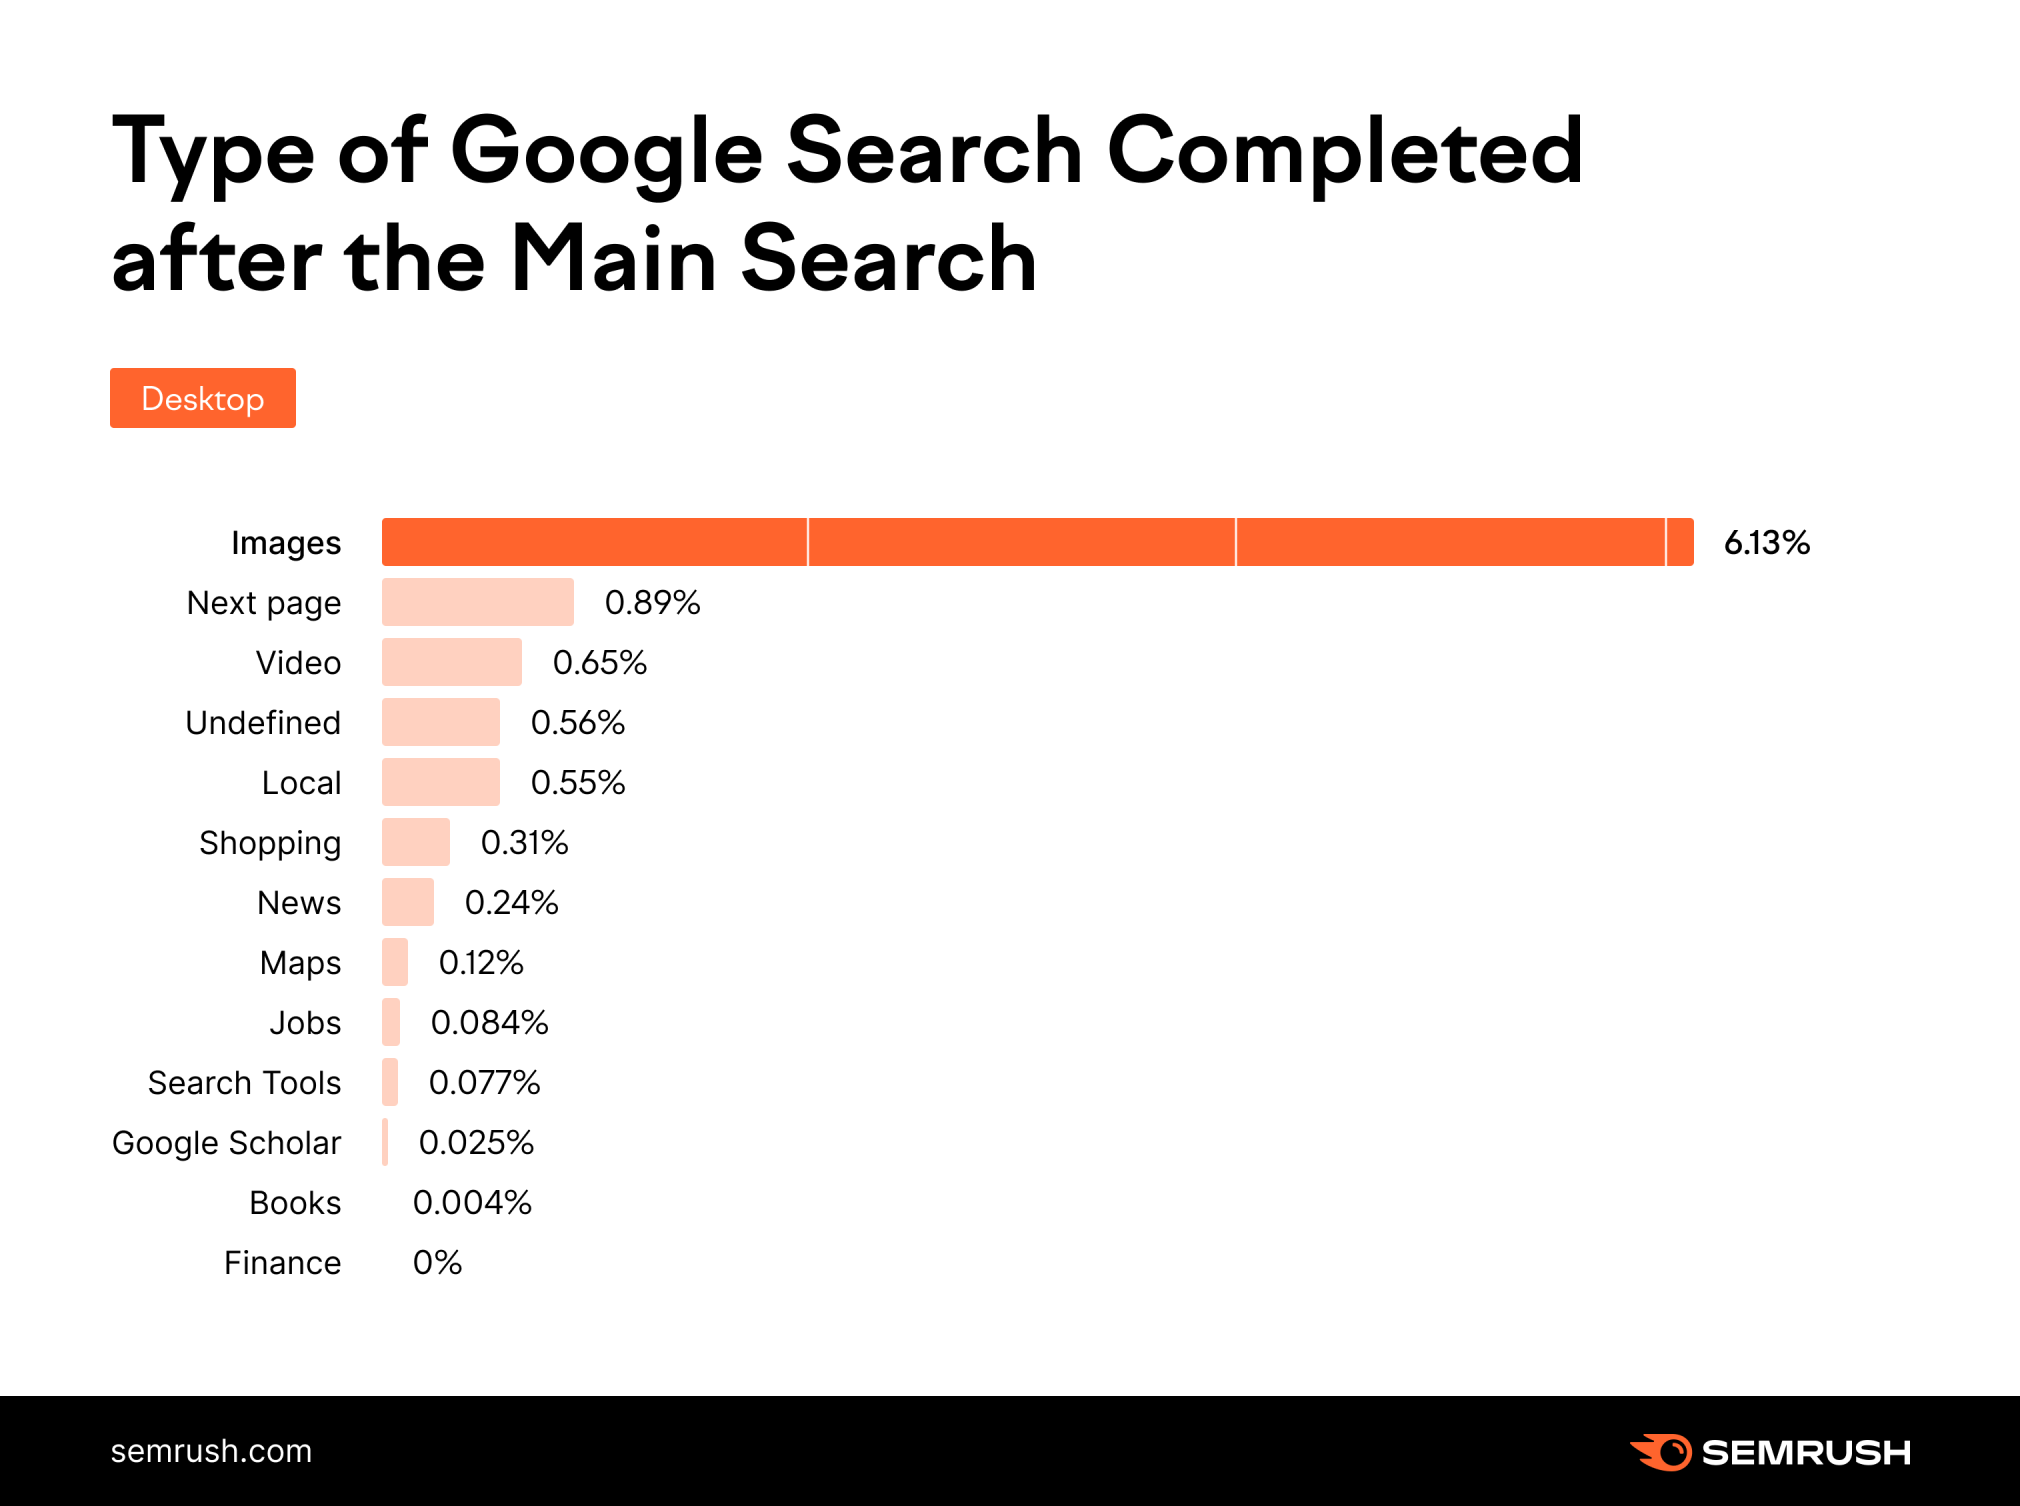
In terms of user movement from one Google property of Search to the next, we can see a clear winner from our data. The vast majority of people jump from the main search to an Image search; these types of follow-up searches represented 6.1% of the whole set, with the next page of results coming in as a distant second choice at 0.9%.
The behavior here might be explained by the sheer number of Image Packs Google shows on the SERP; overall, 51% of SERPs contain the Image Pack. It’s only recently that Google has started showing the image preview when clicking within the Image Pack on the desktop SERP itself. Previously, any click within the Image Pack would have taken you to the Image SERP.
Another interesting story to come out of our data is the difference between searches when a second search occurs.
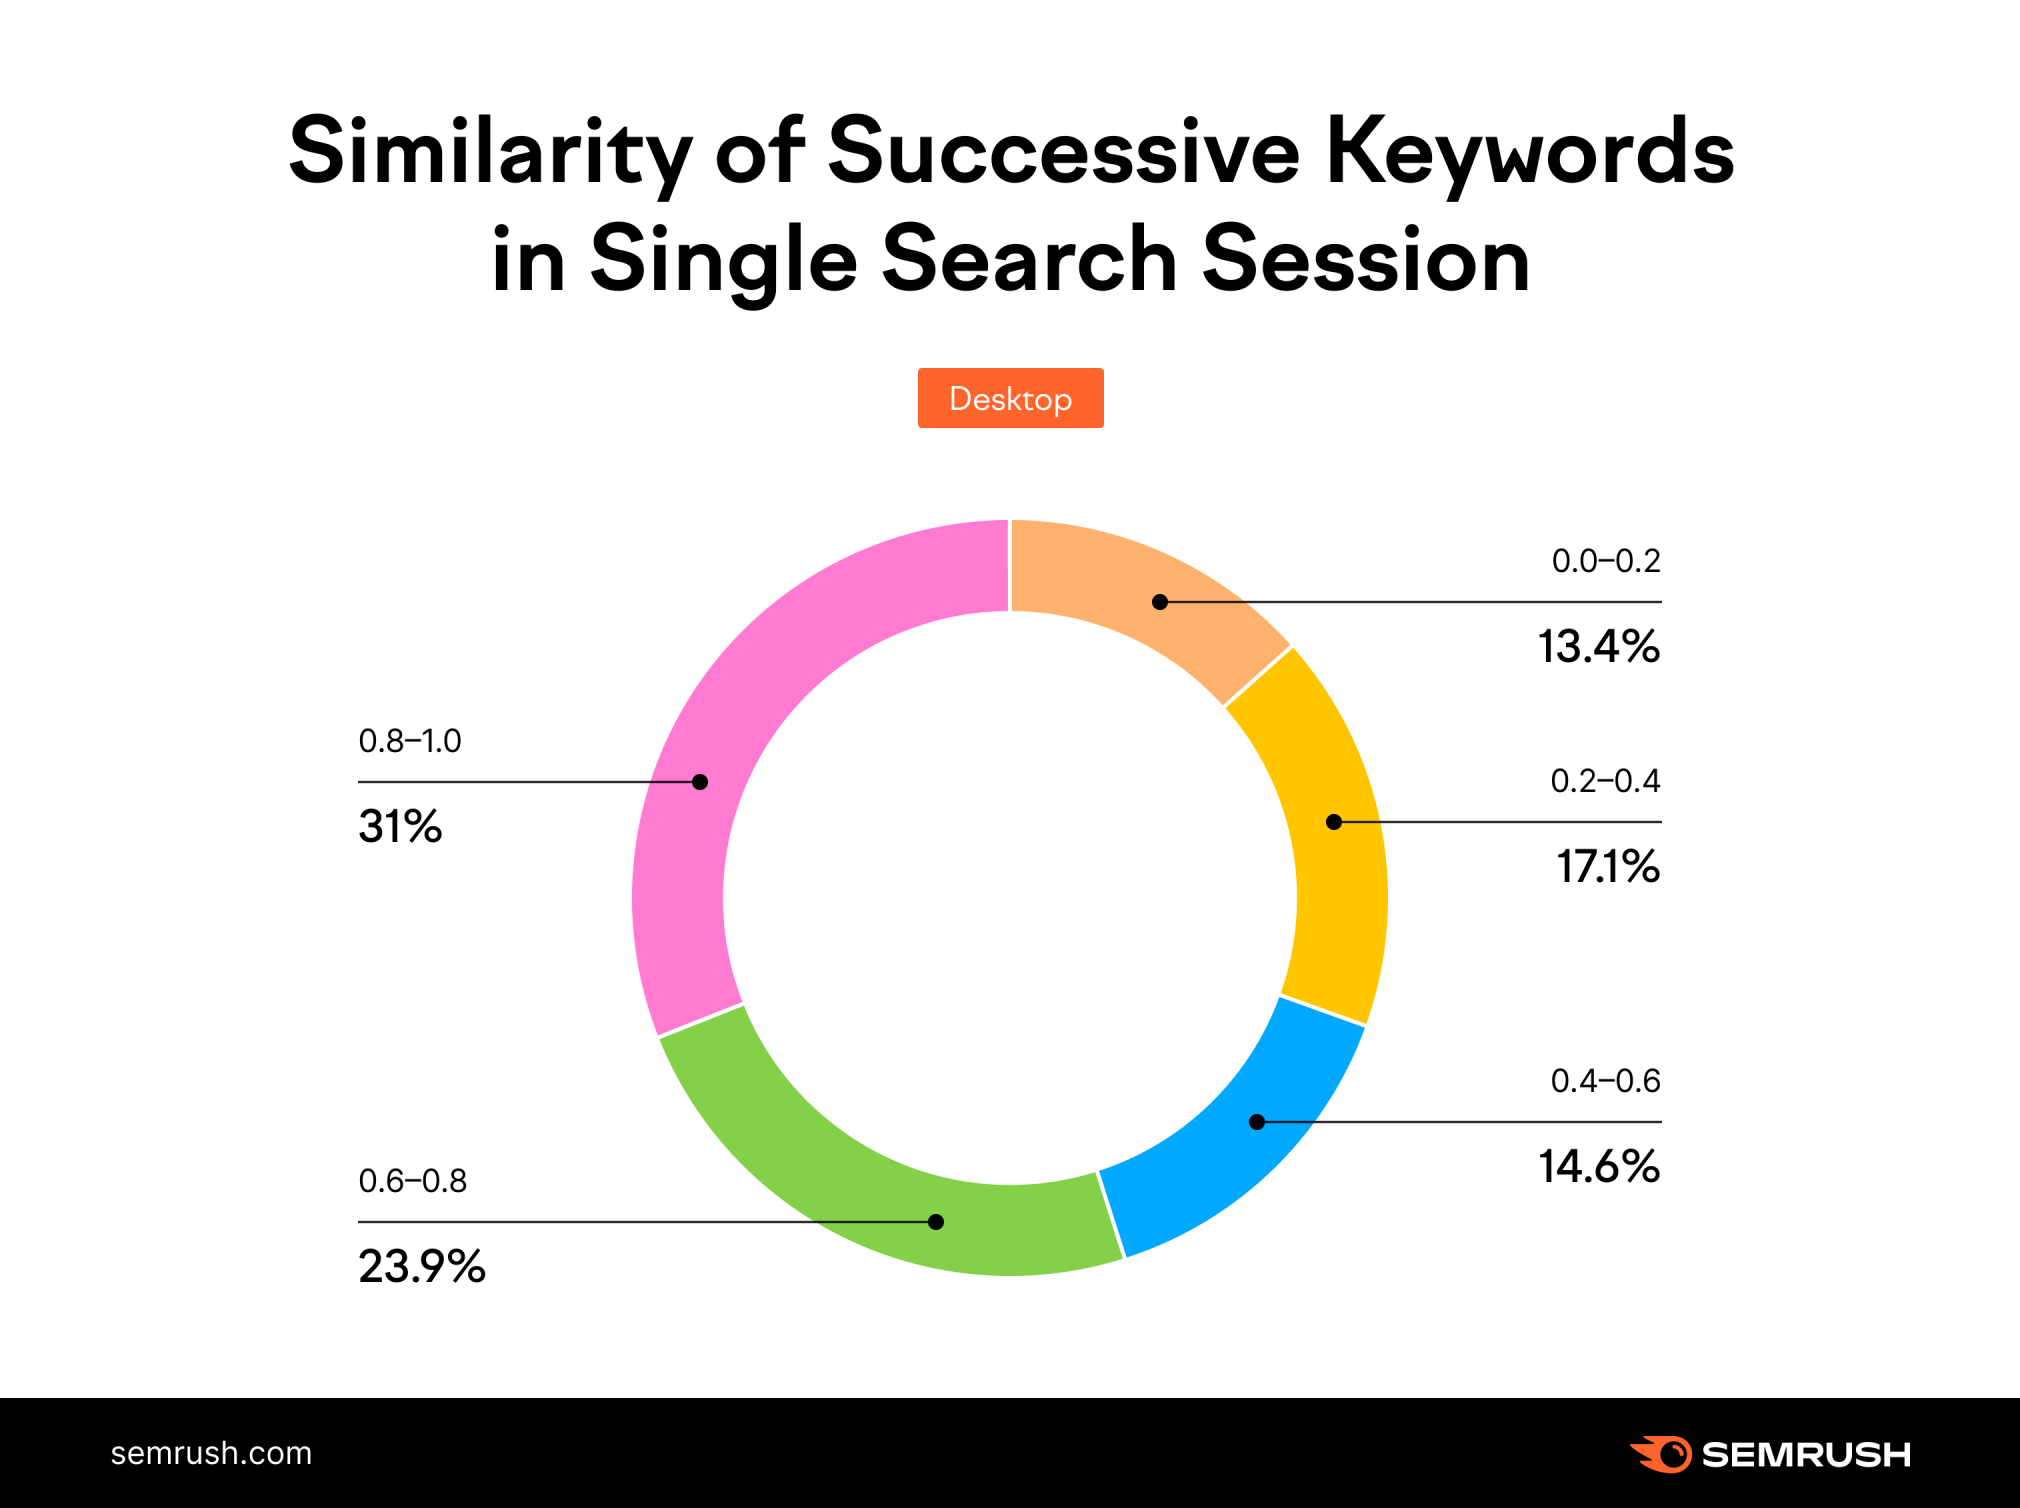
This chart shows the distribution of keyword pairs (the first and second keywords in the sequence, or queue) by similarity. It ranges from 0, which represents no similarity, to 1, which represents exact sequences. The algorithm is based on Ratcliff-Obershelp Pattern Recognition.
We can see that about 55% of the times two searches are performed in a user’s journey contain keywords with a similarity rating of 0.6 (60%) or more, which could mean that many users aren’t satisfied with the results of the first SERP and need to refine their queries.
If we look at the difference in length between the first and second keywords, we find that most follow-up keywords are the same length (this also includes all the edits due to misspellings). In addition, more than 35% of ‘next search’ keywords are 1-2 words longer:
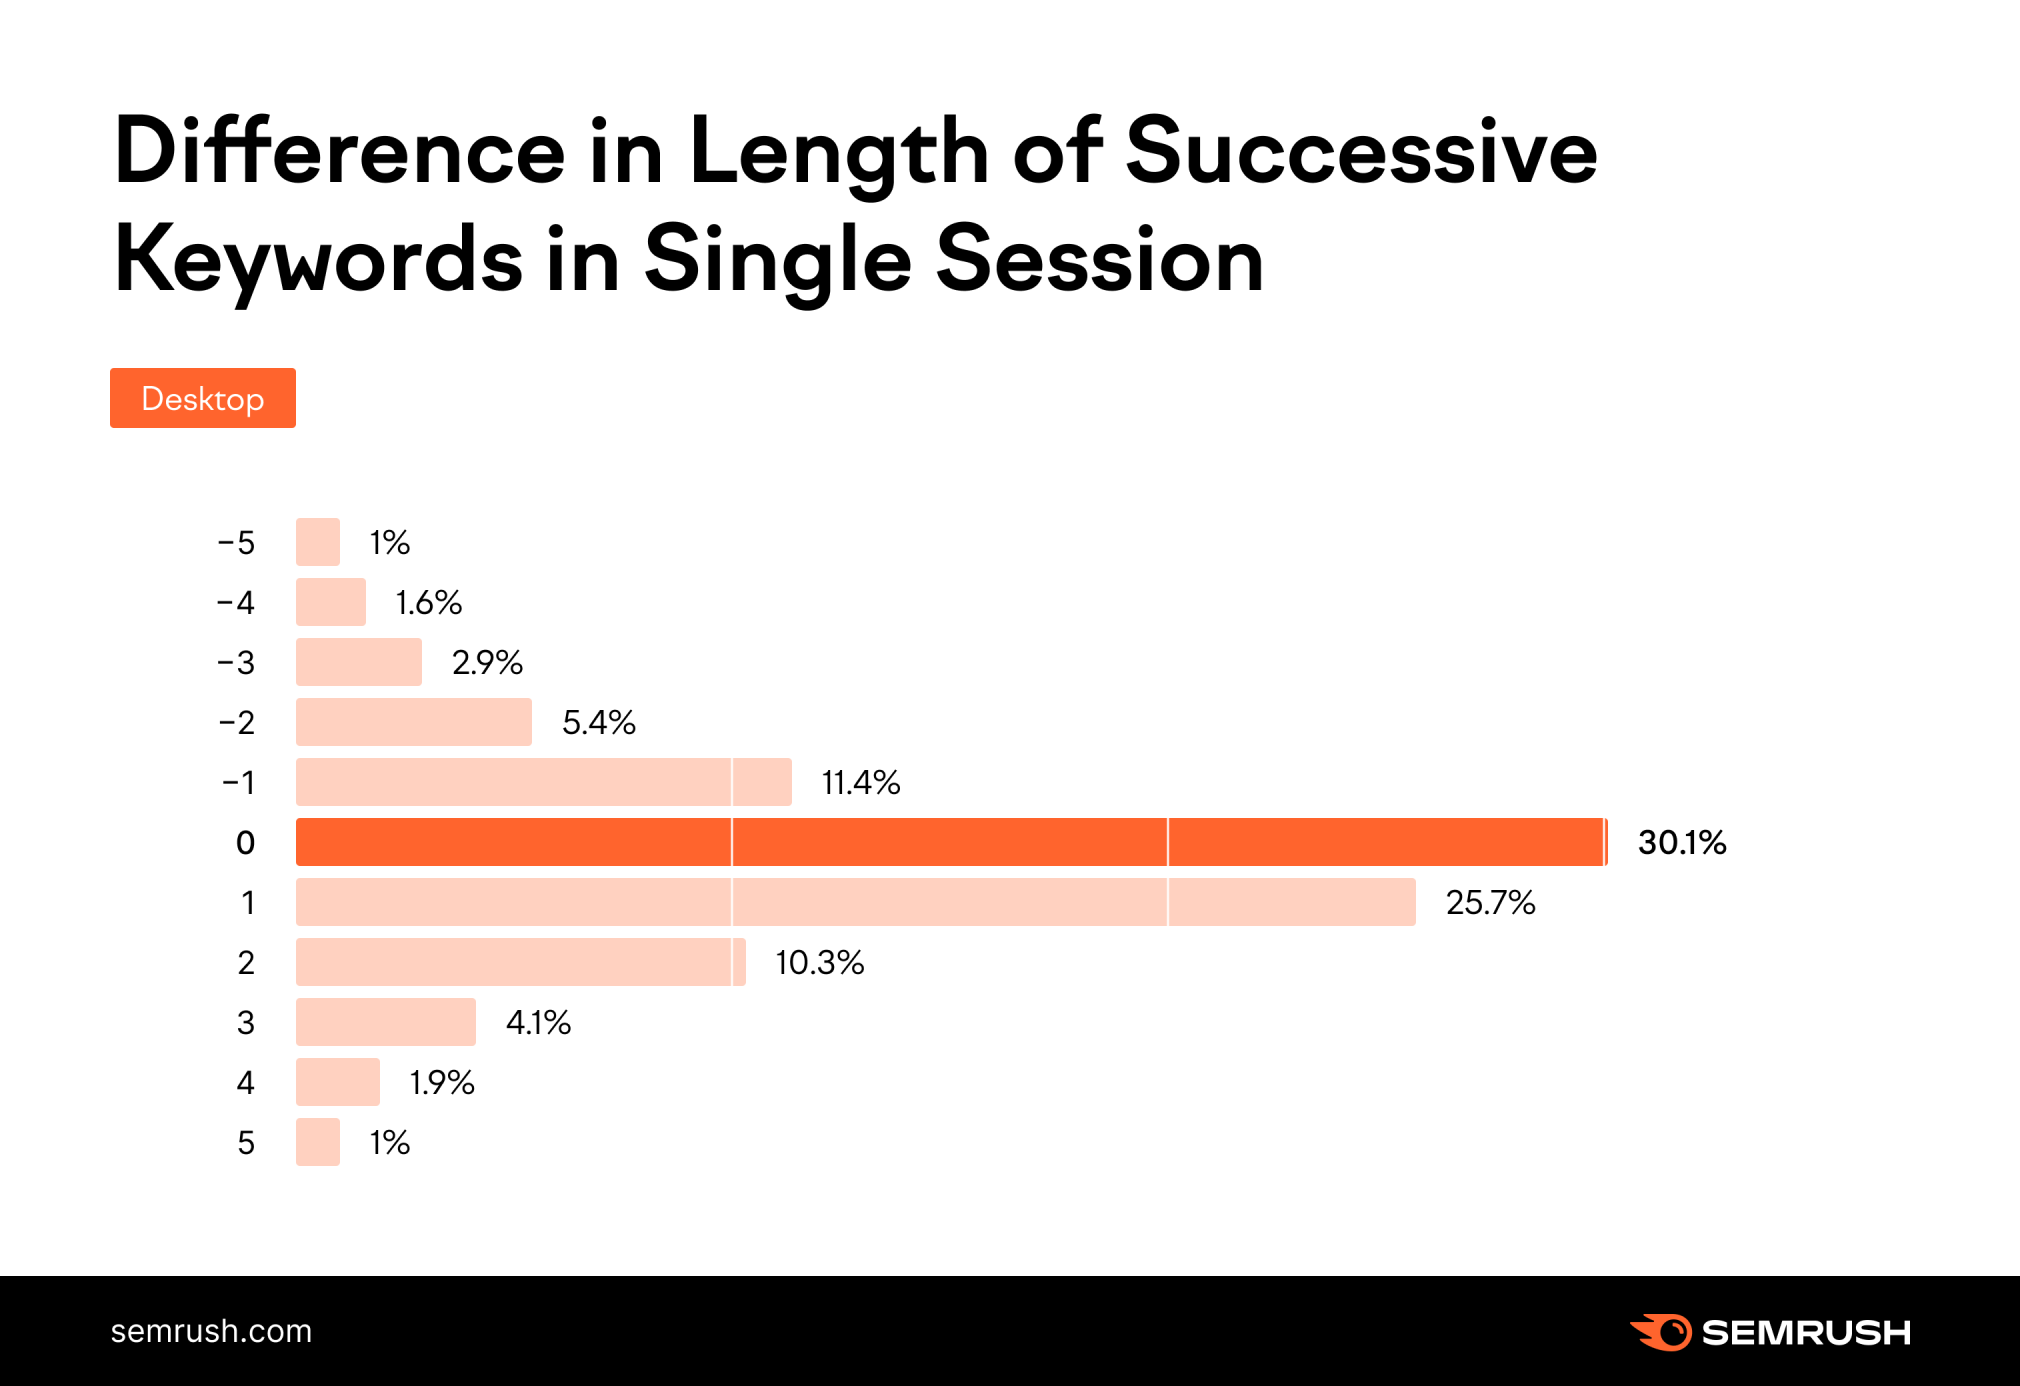
You might assume that people following up with additional searches would use longer terms to find more specific information, but these results suggest otherwise. The fact that over 30% of people are not changing the lengths of their search terms at all could mean that they didn’t need to refine their next query because the initial results were so far off the mark. They might have simply opted for a different search altogether or, indeed, never intended to follow up on the first query—the two searches might be completely unrelated.
Mobile Data
Exploratory Analysis
Now, let’s take a look at the mobile results in more detail and compare them to desktop behaviors where relevant.
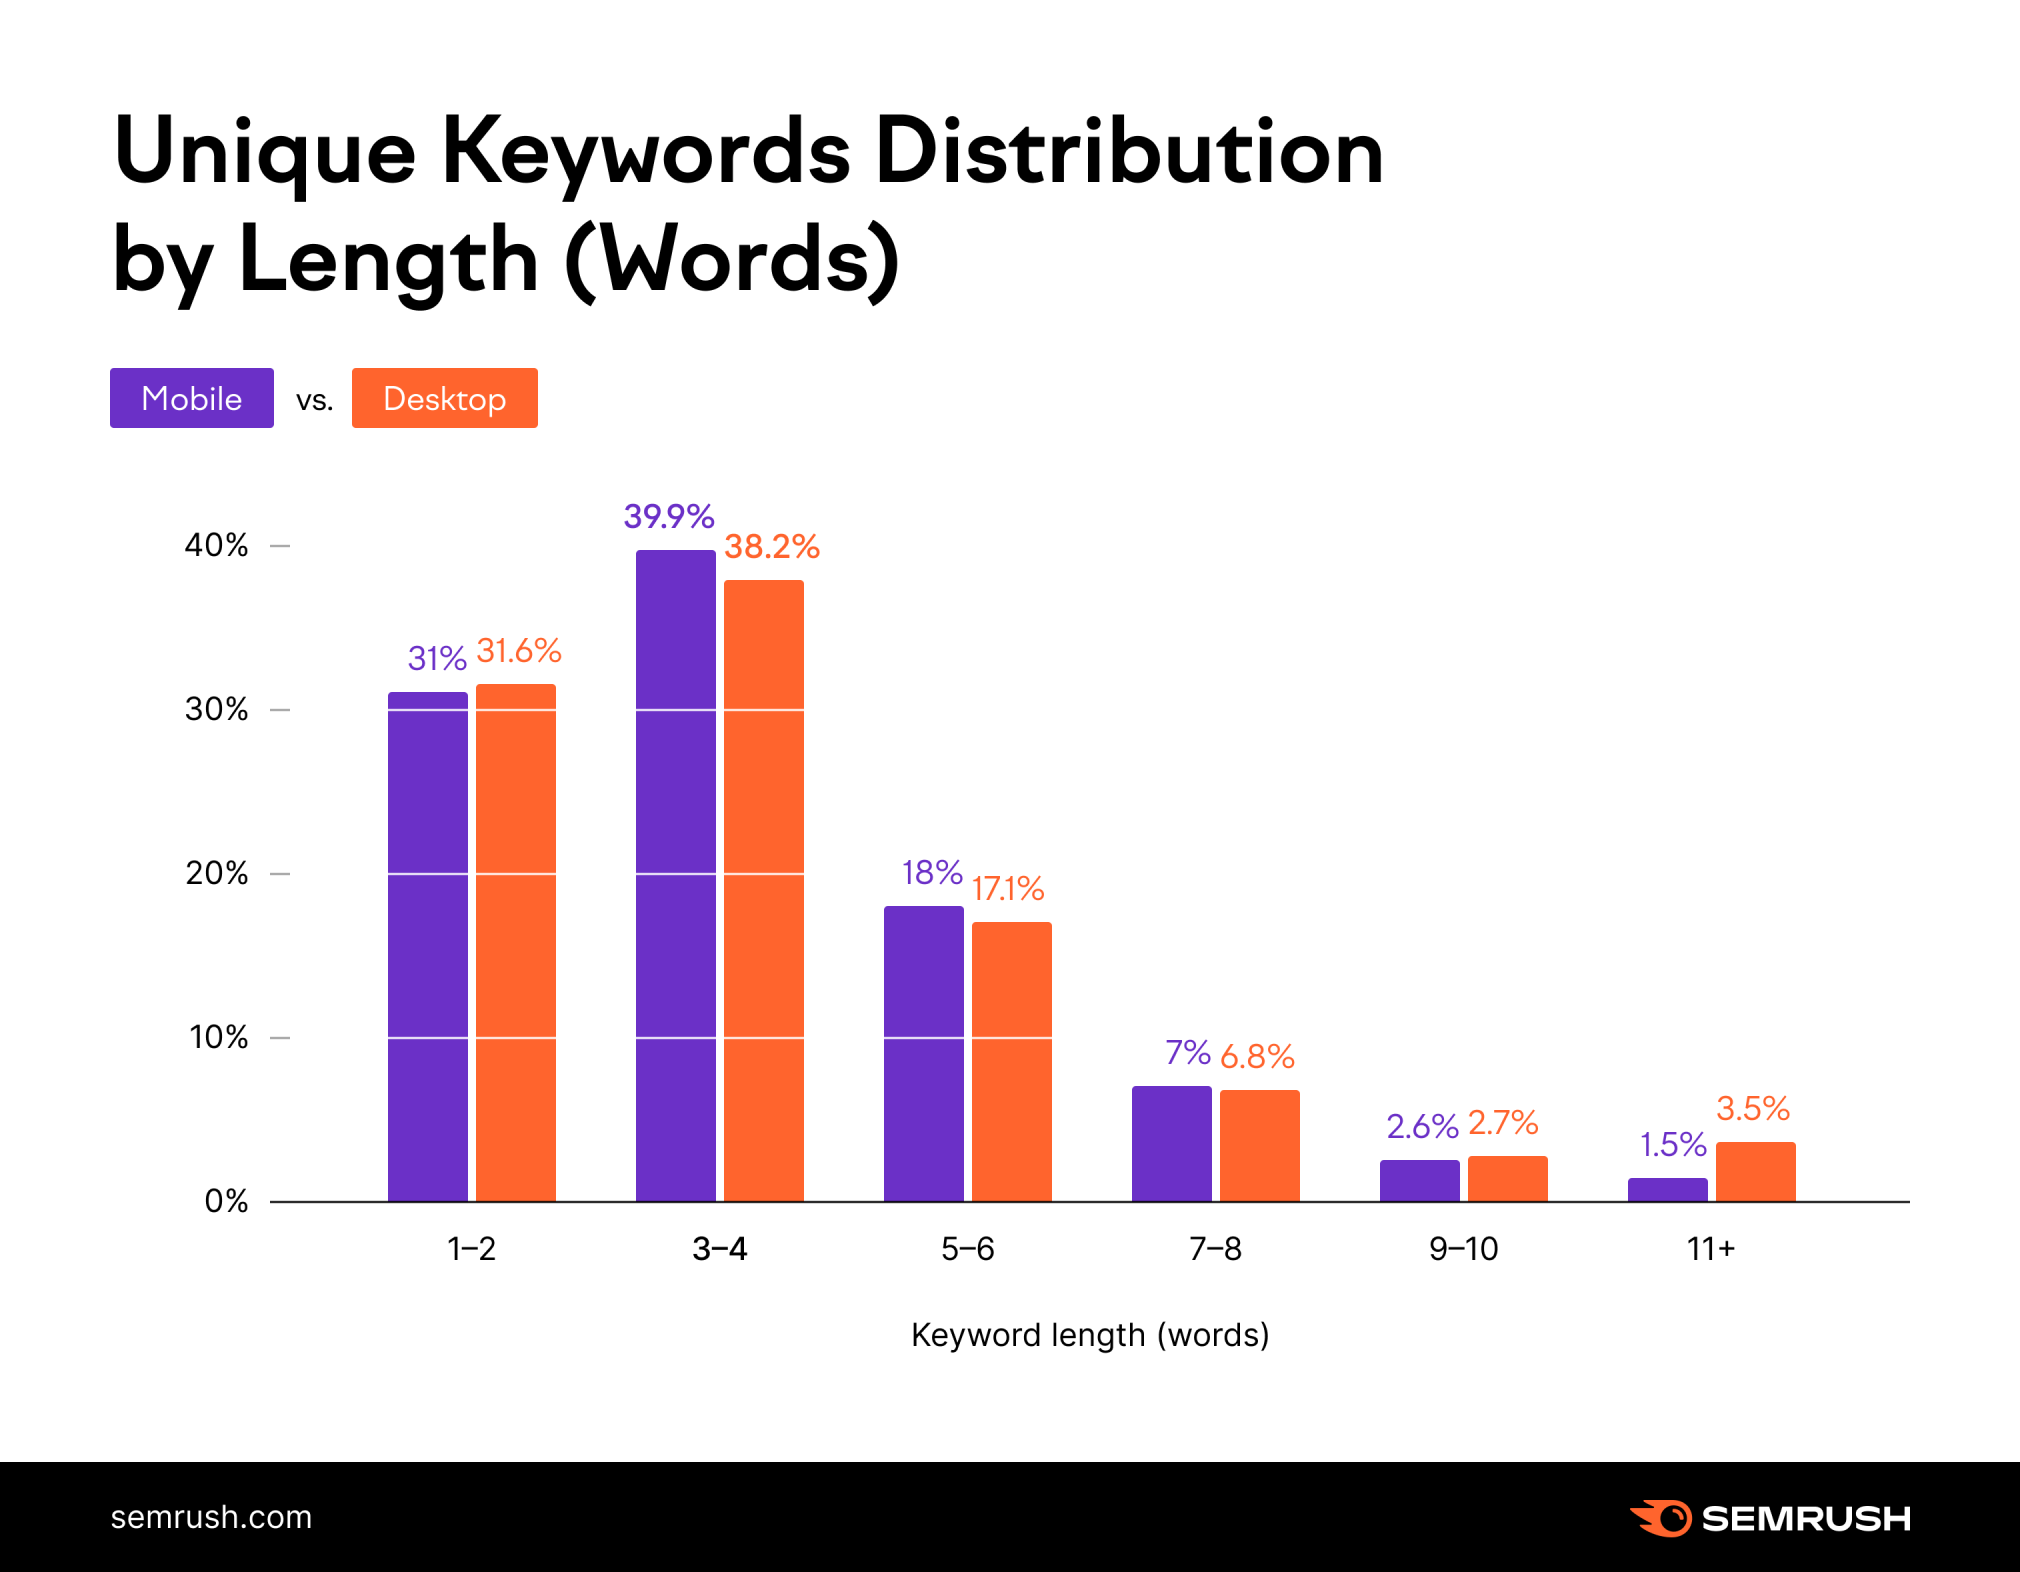
The main thing that jumps out here is that the distribution of keywords by length on mobile looks very similar to the desktop results. However, as you can see from the below, it seems like searchers need slightly more time to decide on the next step while searching on mobile. The reason might be that they are simply using a smaller screen—more time is required to scroll through what Google suggests.
Here’s how that compares to desktop results:
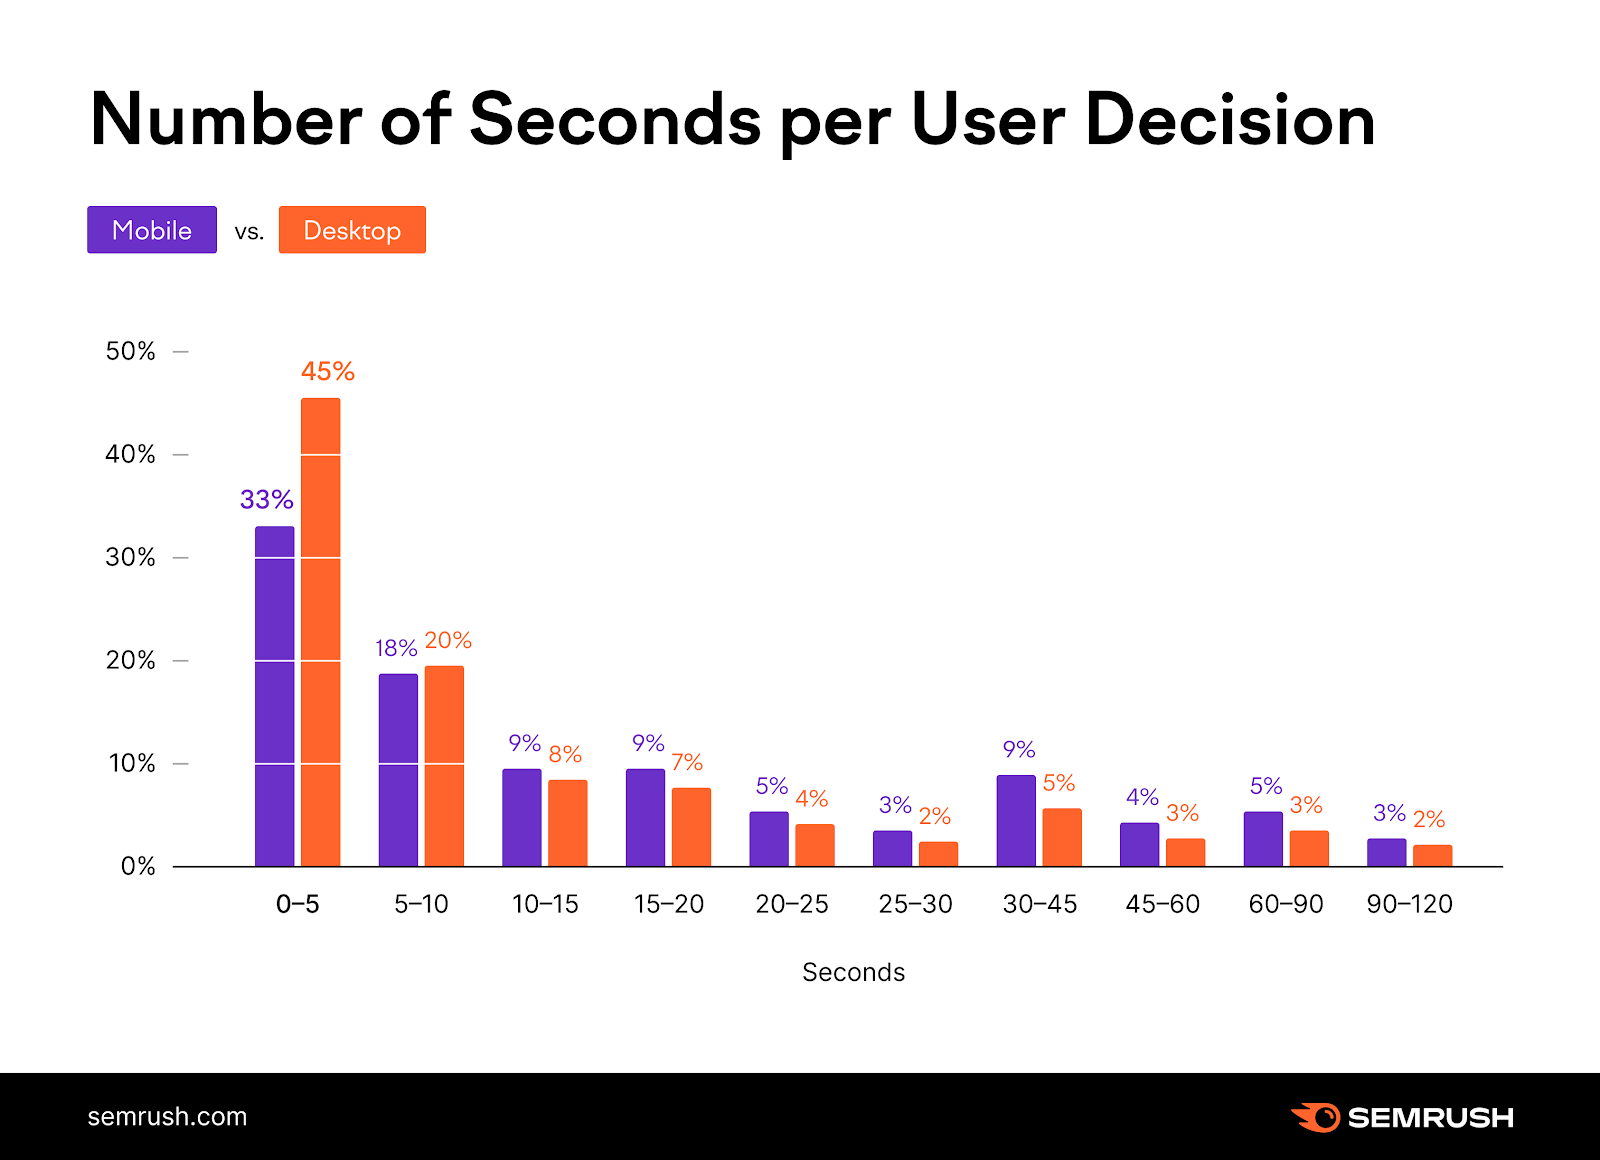
This would seemingly correlate to the ease of access to browse additional results on mobile. It’s quite simple, especially with Google’s semi-infinite scroll, to scroll through more results on mobile than it is on desktop. As the data show, this appears to make users more willing to look at more results on mobile than on desktop, which further weakens that parity between ranking at the same position on desktop and on mobile.
What Main Patterns Emerged from Mobile Data?
The distribution of click-throughs looks a bit different on mobile: the zero clicks share is 57%. The percentage of paid clicks is quite low at only 0.02%. Total clicks on Google are lower here than on desktop, but keyword changes happen more often:
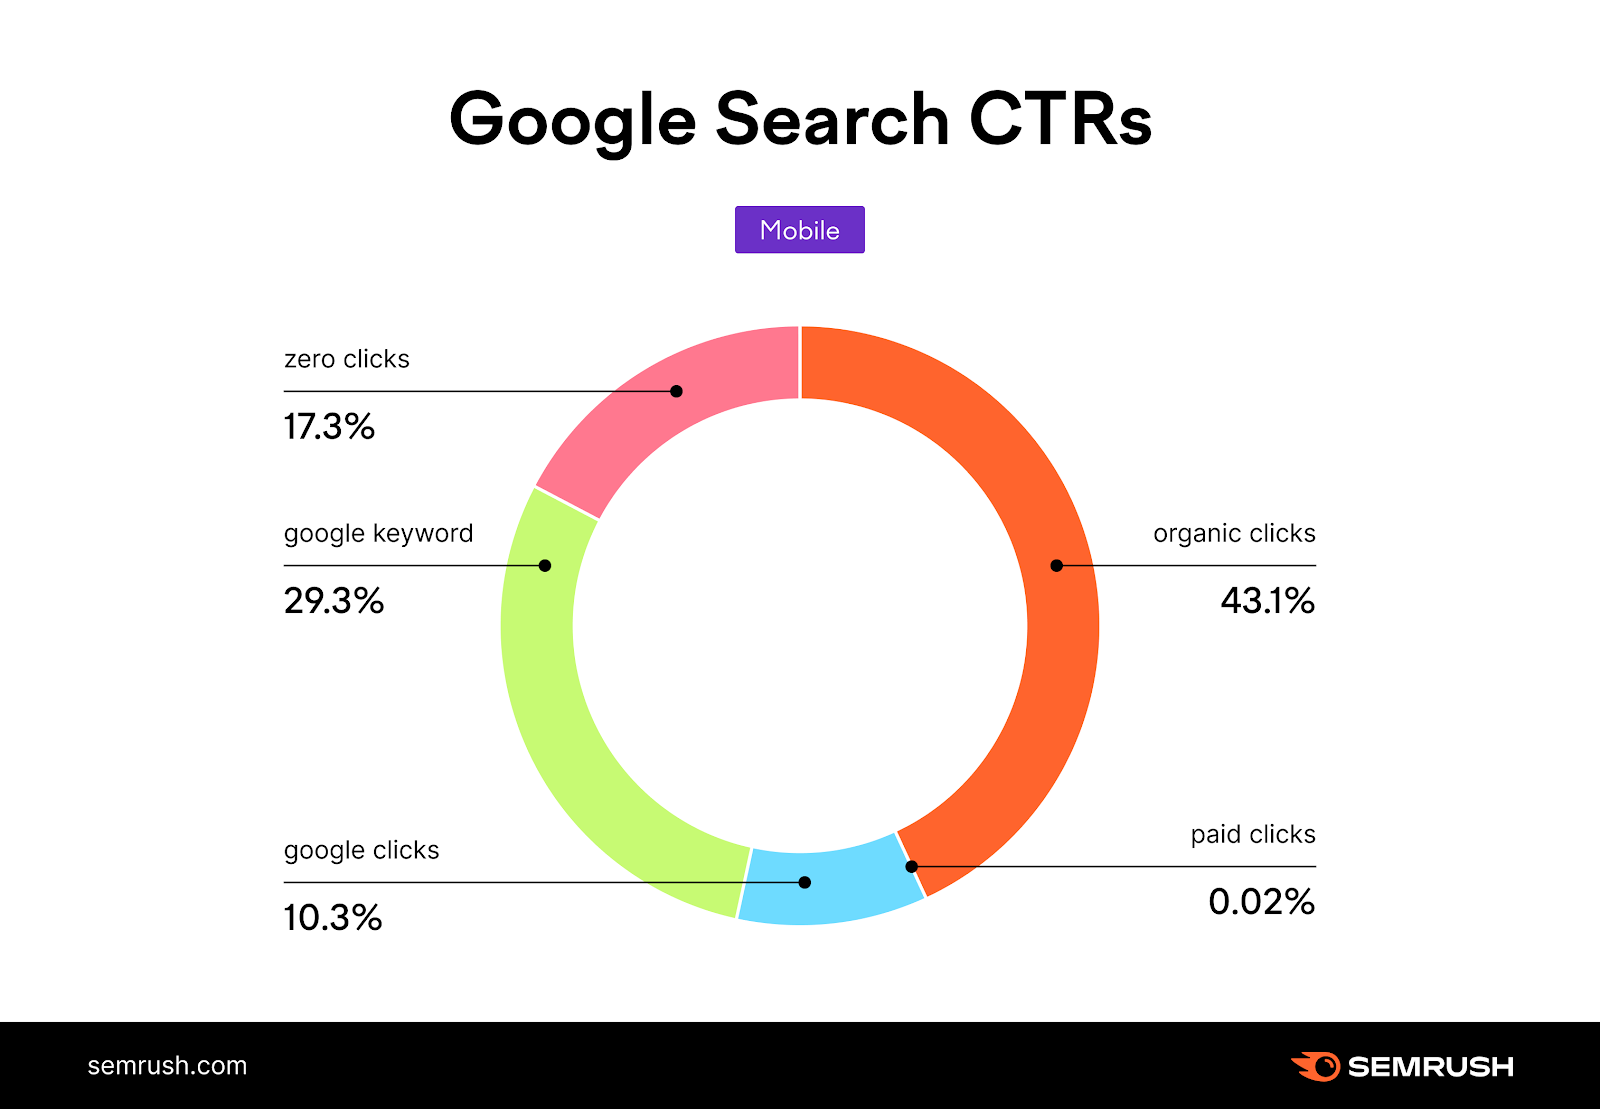
It seems that, as a result of the tendency to look at more results on mobile, the power of Google’s URL-less SERP features diminishes. That is to say that, as users see additional results and/or move past the very top of the SERP because scrolling down is so easy, they tend to ignore the features on the SERP that directly present them with the answer to their query.
In this case, the appeal of features that directly answer a query is lower on mobile. This could be because users who scroll past the top of the SERP features simply don’t go back to it. Whatever the reason, it suggests the limited format presented by the desktop SERP directly plays into the prominence of direct-answer SERP features.
Zero Click Patterns in Mobile Users
As for the search types, Images again are the most popular on mobile by far. However, we see much more frequent ‘undefined’ searches here:
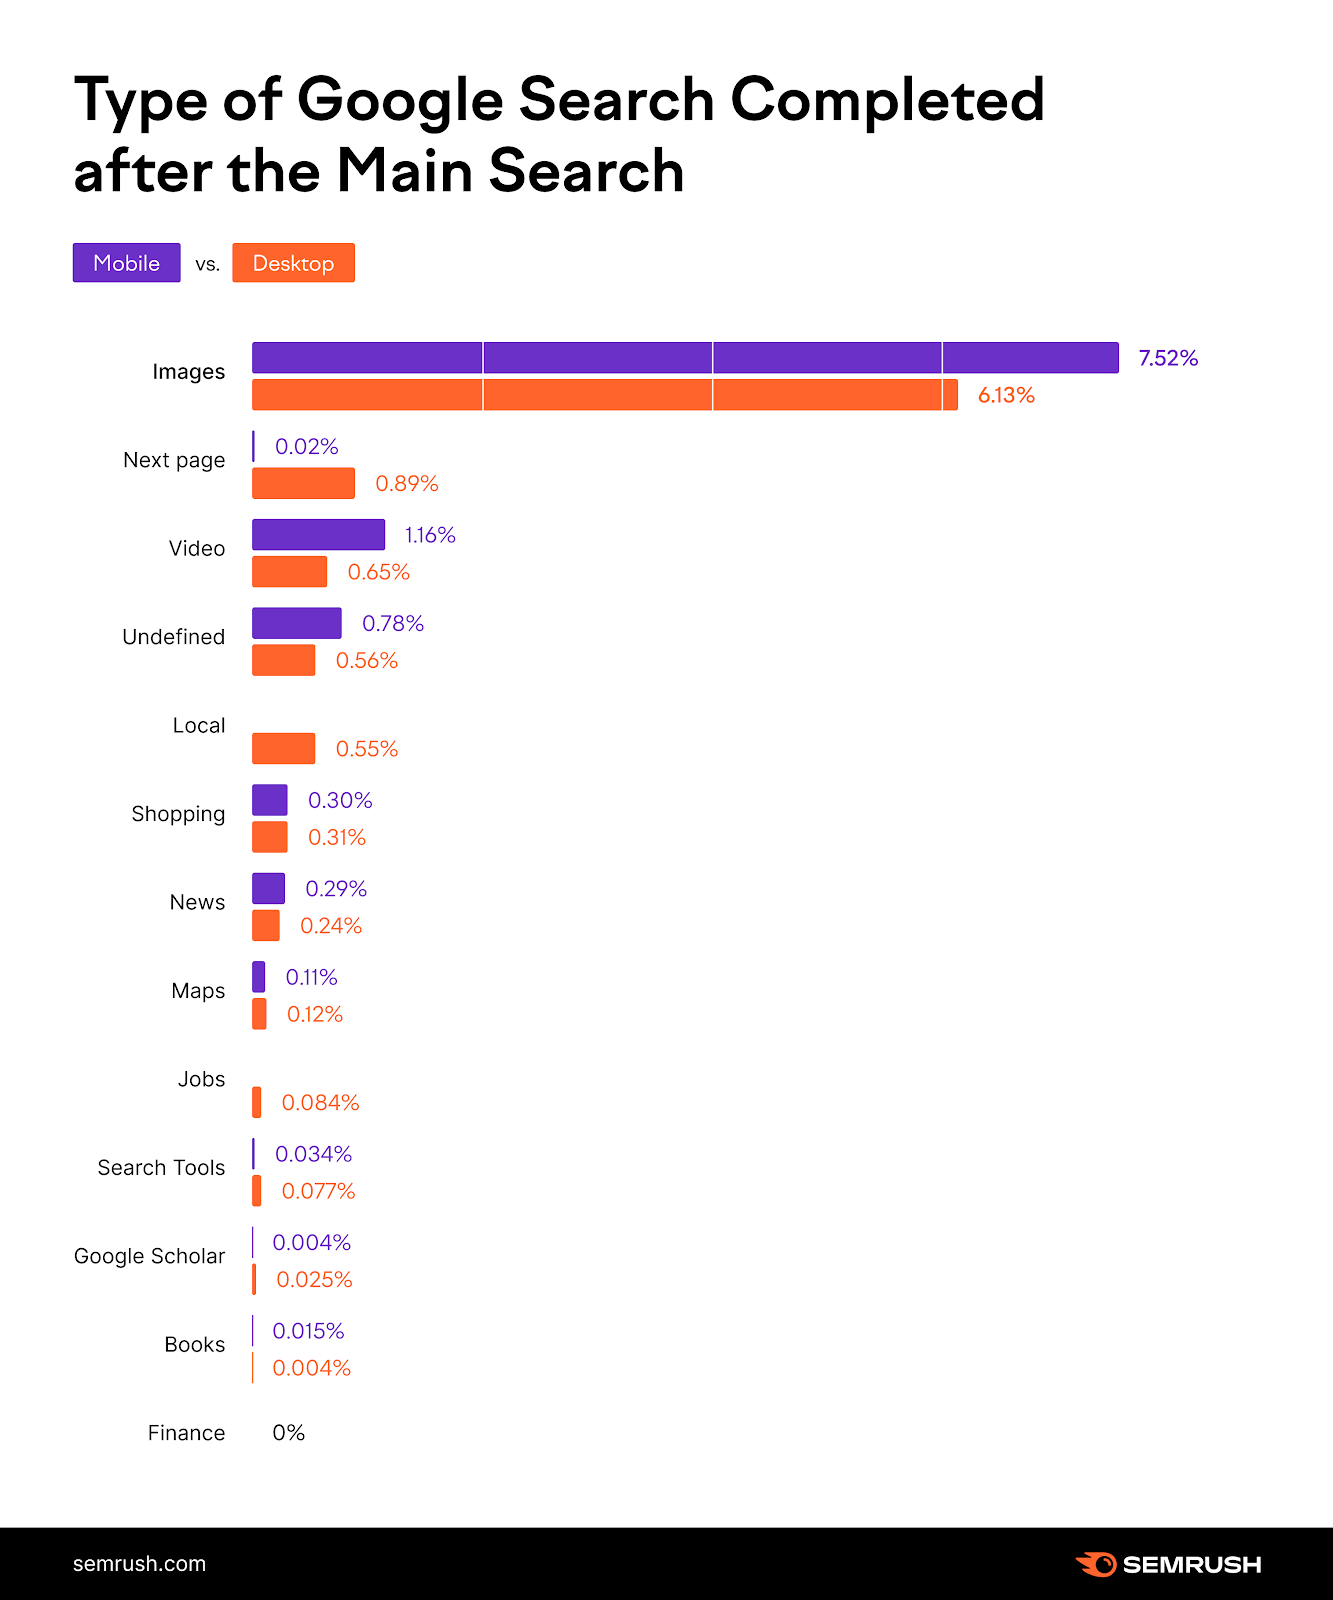
One of the main differences between desktop and mobile searches came in the levels of similarity between the keywords used in quick succession. As you can see from the below, only 38.9% of keyword pairs are 60% similar or more, compared to over half of them (55%) on desktop.

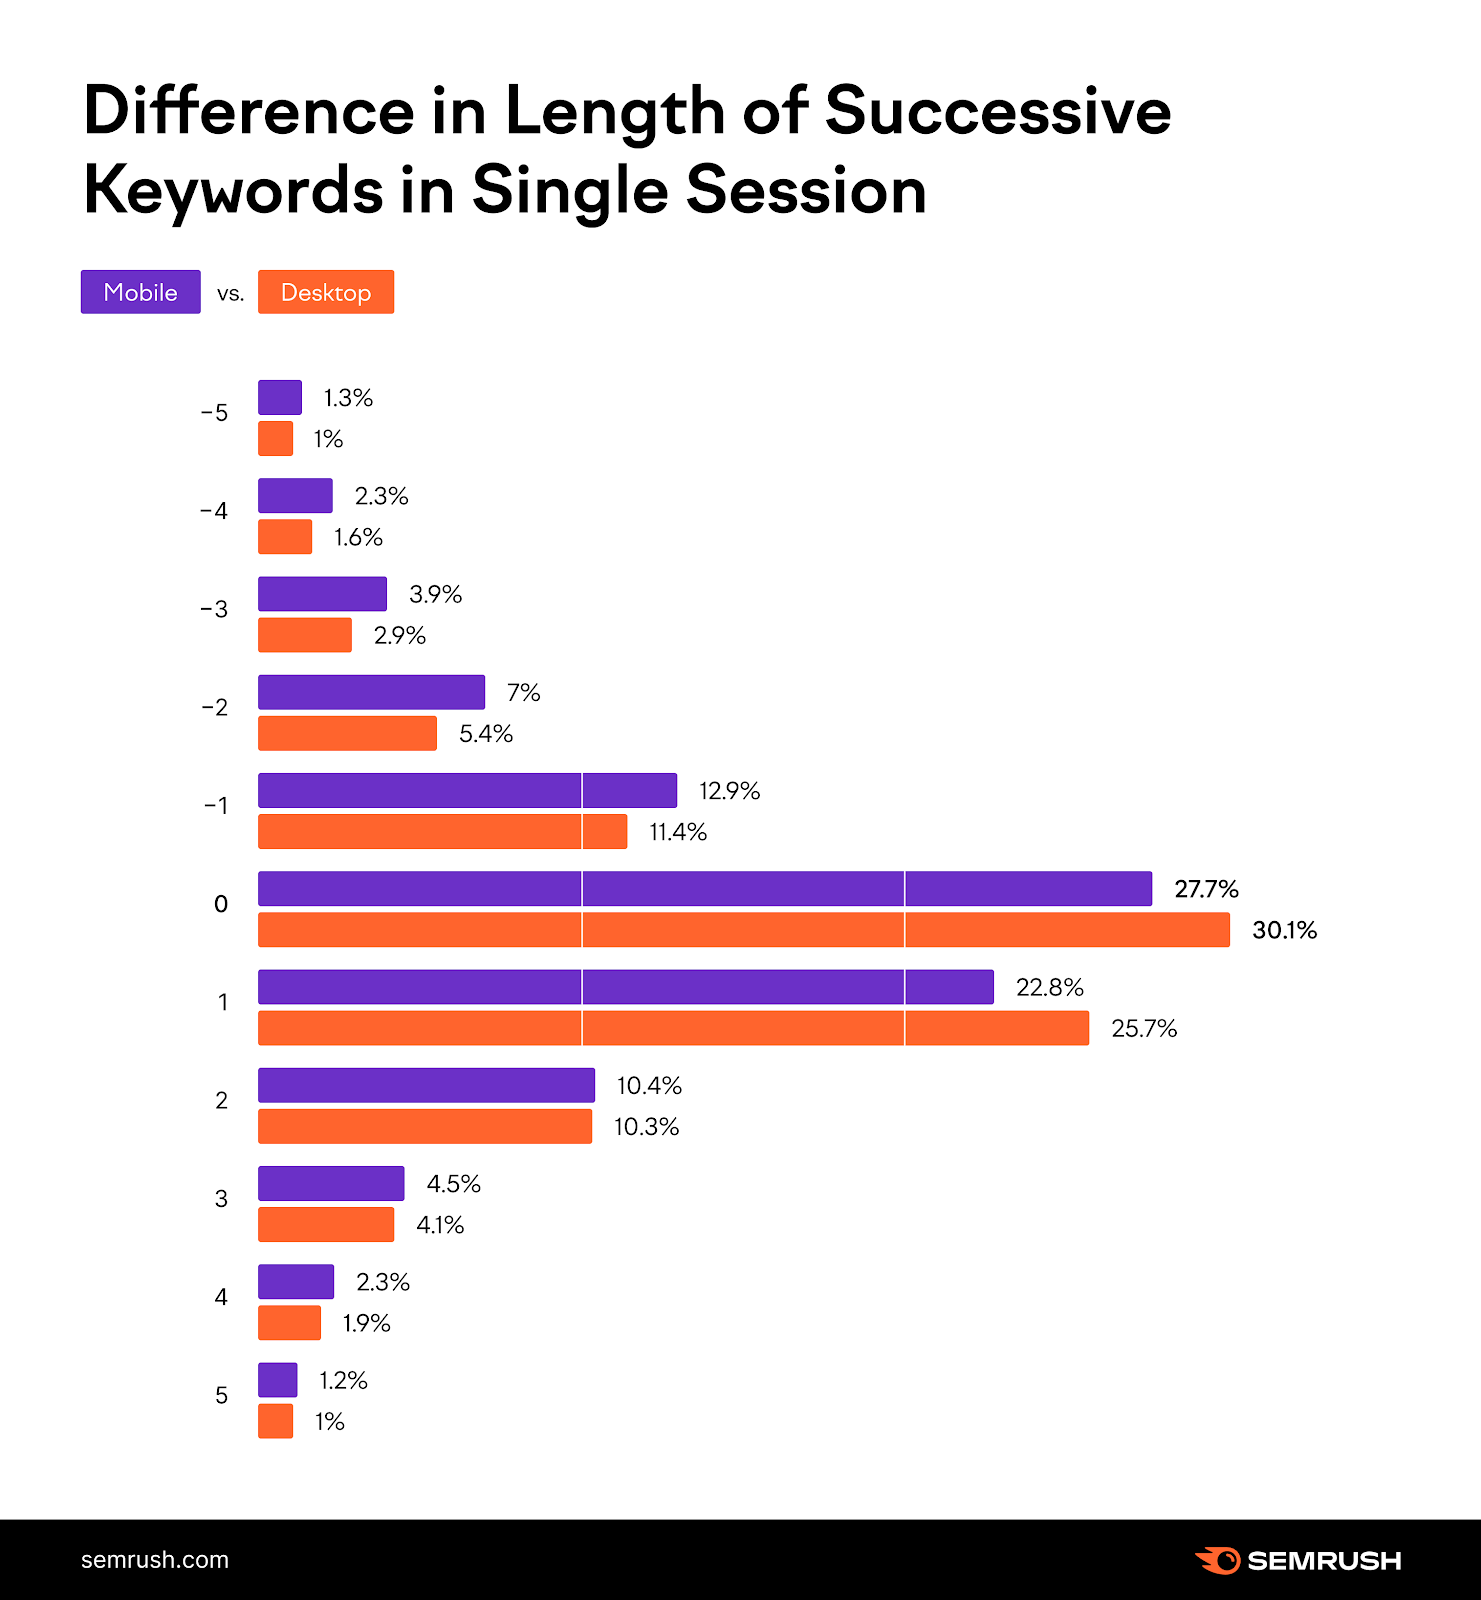
As for the difference in lengths of keywords used in these sessions, the general pattern is the same as it is on desktop—most of the second keywords used in the same session are the same length. However, more than 27% of those second keywords are shorter than the first query here, while the equivalent sits at about 22.3% on desktop:
What Does This Mean for User Journeys and Behaviors in Search?
Let’s talk about the obvious issue here. On desktop, 25.6% of searches are what we’ve termed “zero clicks.” Now, this can mean a variety of things in terms of user behavior, but let’s just take the worst case scenario: these “zero clicks” mean that the user found the answer on the Google SERP and never went to a website.
One might assume that this points to some sort of imbalance on the SERP, but this may not be entirely the case. Content is constantly evolving—in fact, content evolves relatively quickly. What we create, how we create it, how users consume, and what users expect out of that content is rapidly and constantly changing.
Fewer than 100 years ago, families sat around the radio listening to evening programs, not TVs. In more recent times, the advent of digital music streaming has done to CDs what digital news content has done to newspaper circulation.
The point is that content changes and so, too, do user demands for content. While users of a few years ago may have been happy to click on a weather site to see the forecast, we can see from this study that today’s users prefer to get that information in a more direct manner, such as via an Answer Box on the SERP. They regularly don’t even leave the SERP at all.
So, this begs the question: Is Google providing a less ‘clickable’ experience to divert traffic away from websites, or is it doing so because this is what users now demand?
The Need for Quicker, Faster, Easier Information
The fact that Google provides URL-less content in the form of direct answers on the SERP would suggest alignment with a new demand for ease of access. It’s similar to the reason we get push notifications from apps on our phones. People want more immediate and digestible information. As a concept then, Direct Answers on the SERP align with the evolution of content and consumer expectations.
This seems to be reflected in the discrepancy between desktop and mobile here, where zero clicks accounted for 17.3% of all searches. Users are not inherently looking to avoid a click, but they are instead looking to acquire information quicker. Two features of Search today facilitate that: Direct Answers and an optimized, semi-infinite scroll experience on mobile.
It’s further evidenced by the fact that organic clicks didn’t go up on mobile, but keyword change did—mobile users were far more likely to engage in multiple searches than desktop users. Only 17.9% of queries were users running a new keyword on desktop, while that number was 29.3% on mobile. People are more involved in and engaged with the experience on mobile than they are on desktop, which points to the rise in zero clicks and the demand for such ease of access.
Understanding the Complexities of User Journeys
Another strong theme that emerged from these results is that of SERP refinement. Users on both desktop and mobile produced a new Google URL around 10% of the time, which means, in some way, they moved from one SERP to the next. That action could have been simply moving from the main SERP to another, or it could mean engaging with a carousel or filter that moved the user to a new SERP.
This is significant because it shows that the journey a user takes toward their ultimate destination may be more complex than commonly thought. The basic fact that Google offers so many access points to its other SERPs with images, videos, and products, along with a plethora of filtering options via carousels and the like, is probably enough evidence of this in itself.
Whether the user wants a different format or greater refinement after their first search, Google facilitates the next steps in their journeys with various filters and access points. It’s as clear an indication as any that Search is constantly adapting to user needs and behaviors, which is part of what makes the zero click phenomenon so fascinating.
What do you think of these findings? What’s your stance on zero clicks and how it’s affecting your SEO strategy?
